[Date Prev][Date Next][Thread Prev][Thread Next][Date Index][Thread Index]
bug#22301: 25.1.50; Emacs crashes while lisp debugging
|
From: |
Vincent Belaïche |
|
Subject: |
bug#22301: 25.1.50; Emacs crashes while lisp debugging |
|
Date: |
Mon, 04 Jan 2016 23:49:53 +0100 |
Dear Éli,
Answers below...
Le 04/01/2016 16:54, Eli Zaretskii a écrit :
>> From: Vincent Belaïche <vincentb1@users.sourceforge.net>
>> Cc: Vincent Belaïche <vincent.belaiche@gmail.com> ,
>> 22301@debbugs.gnu.org
>> Date: Mon, 04 Jan 2016 09:00:42 +0100
>>
[...]
>>
>> The debugging session is still opened, so please feel free to give
>> instructions if you want further details.
>
> Thanks. Please type this at GDB prompt:
>
> (gdb) thread 1
> (gdb) thread apply all bt
>
> and post here everything that GDB produces.
>
> Please leave the debugging session running after you do that, in case
> we will need to ask you to look around some more.
Here is it:
--8<----8<----8<----8<----8<-- begin -->8---->8---->8---->8---->8----
(gdb) thread 1
[Switching to thread 1 (Thread 11676.0x1edc)]
#0 SDATA (string=1461725984) at lisp.h:1325
1325 return XSTRING (string)->data;
(gdb) thread apply all bt
Thread 7 (Thread 11676.0x430):
#0 0x771b8c51 in ntdll!DbgBreakPoint () from C:\WINDOWS\SYSTEM32\ntdll.dll
#1 0x771e9e09 in ntdll!DbgUiRemoteBreakin ()
from C:\WINDOWS\SYSTEM32\ntdll.dll
#2 0xfb32daaf in ?? ()
#3 0x771e9dd0 in ntdll!DbgUiIssueRemoteBreakin ()
from C:\WINDOWS\SYSTEM32\ntdll.dll
#4 0x760238f4 in KERNEL32!BaseThreadInitThunk ()
from C:\WINDOWS\SYSTEM32\kernel32.dll
#5 0x771a56c3 in ntdll!RtlUnicodeStringToInteger ()
from C:\WINDOWS\SYSTEM32\ntdll.dll
#6 0x00000000 in ?? ()
Lisp Backtrace:
"backtrace" (0xbfedac)
"debugger-setup-buffer" (0xbfefe0)
"debug" (0xbff1b4)
"ses-relocate-all" (0xbff200)
"let" (0xbff3bc)
"ses-delete-row" (0xbff598)
"funcall-interactively" (0xbff594)
"call-interactively" (0xbff710)
"command-execute" (0xbff8dc)
Thread 6 (Thread 11676.0x2aa0):
#0 0x771b868c in ntdll!ZwWaitForWorkViaWorkerFactory ()
from C:\WINDOWS\SYSTEM32\ntdll.dll
#1 0x7718a246 in ntdll!EtwNotificationRegister ()
from C:\WINDOWS\SYSTEM32\ntdll.dll
#2 0x760238f4 in KERNEL32!BaseThreadInitThunk ()
from C:\WINDOWS\SYSTEM32\kernel32.dll
#3 0x771a56c3 in ntdll!RtlUnicodeStringToInteger ()
from C:\WINDOWS\SYSTEM32\ntdll.dll
#4 0x00c844c0 in ?? ()
#5 0x771a568e in ntdll!RtlUnicodeStringToInteger ()
from C:\WINDOWS\SYSTEM32\ntdll.dll
#6 0xffffffff in ?? ()
#7 0x771cb6c3 in ntdll!RtlCaptureContext ()
from C:\WINDOWS\SYSTEM32\ntdll.dll
#8 0x00000000 in ?? ()
--8<----8<----8<----8<----8<-- end -->8---->8---->8---->8---->8----
Please note that I don't get again the debugger prompt --- I am running
the debugger from an Emacs shell buffer, could it be some interaction
that the buffer process sentinel could not capture ? Anyway, I am
keeping the gdb session open, as you asked...
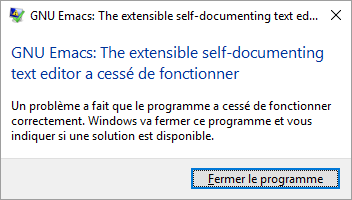
Not sure whether that is useful or not, but please also note that when
Emacs crashed, then I did not get the Yes/No popup asking to attach the
debugger, etc... but the MSWindow usual crash popup (PNG attached)
VBR,
Vincent
 Sans titre.png
Description: PNG image
- bug#22301: 25.1.50; Emacs crashes while lisp debugging, Vincent Belaïche, 2016/01/03
- bug#22301: 25.1.50; Emacs crashes while lisp debugging, Eli Zaretskii, 2016/01/03
- bug#22301: 25.1.50; Emacs crashes while lisp debugging, Vincent Belaïche, 2016/01/04
- bug#22301: 25.1.50; Emacs crashes while lisp debugging,
Vincent Belaïche <=
- bug#22301: 25.1.50; Emacs crashes while lisp debugging, Vincent Belaïche, 2016/01/05
- bug#22301: 25.1.50; Emacs crashes while lisp debugging, Vincent Belaïche, 2016/01/14
- bug#22301: 25.1.50; Emacs crashes while lisp debugging, Vincent Belaïche, 2016/01/14
- bug#22301: 25.1.50; Emacs crashes while lisp debugging, Vincent Belaïche, 2016/01/15
- bug#22301: 25.1.50; Emacs crashes while lisp debugging, Vincent Belaïche, 2016/01/19