Thanks for your reply Sebastiaan,
I am taking some data samples with a piece of code in Windows that takes the raw data samples. Now, I want to analyze the samples, whether my data is correct or not. For this, I tune to the FM frequency of 106.2 MHz (a radio station) and pick some data samples.
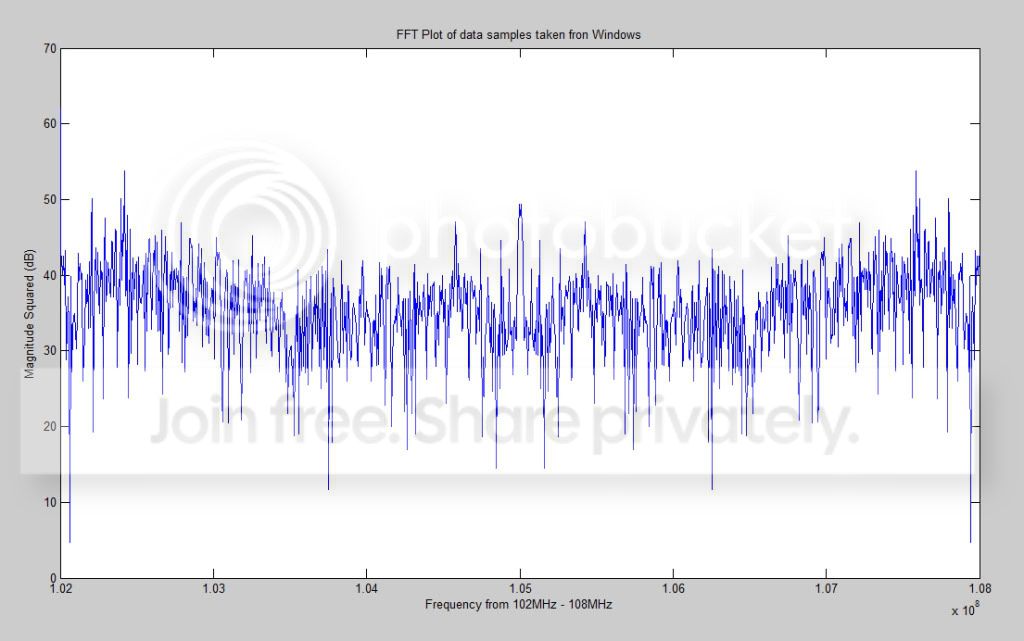
I arbitaraily picked 956 samples and took their FFT, kept my x-axis label between 105 - 108 MHz and made a plot in MATLAB:
The decimation rate is 250, so my sampling frequency in this case is 64Msps/250 = 256KHz
Now, shouldn't I be seeing a peak at 106.2 MHz? Instead at 105MHz? There is no station at 105MHz.
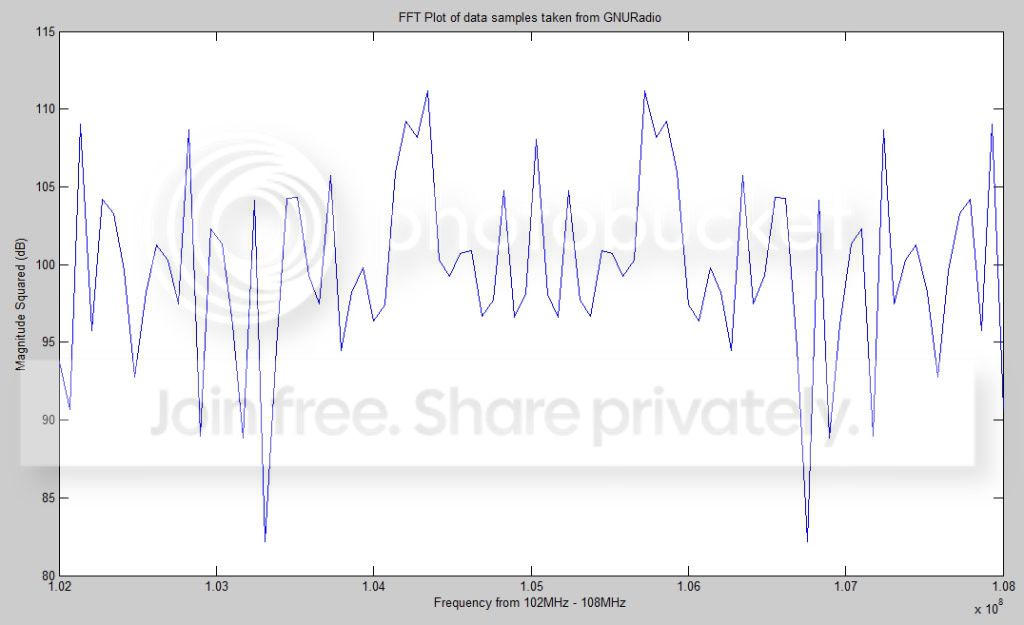
For comparison I also took some data samples from GNURadio for the same frequency with Octave and plotted them in MATLAB:
Even here I don't see a peak at 106.2MHz
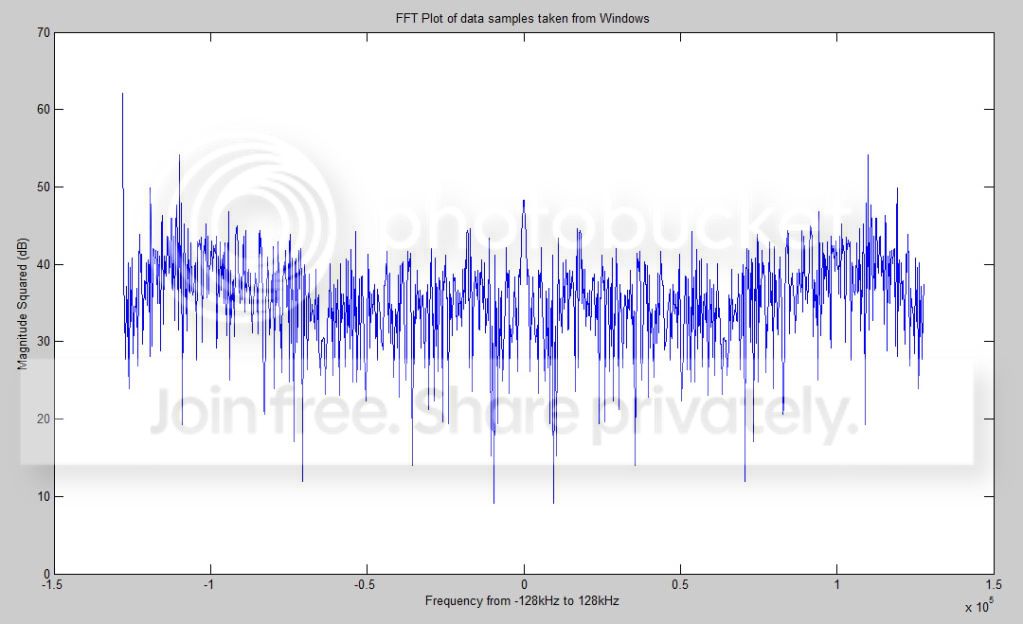
I also used the values that you told me: -samp_freq/2:samp_freq/no_samples:(samp_freq/2)-1
as my decimation rate is 250, my sampling frequency is: 256kHz
and the no. of samples I am using is 956
so my range is: -128kHz:256kHz/956:127.999kHz
Here is the plot, again taken from Windows:
Now I don't see any peak at 106.2MHz in any of these plots. What could be the problem?
On Sun, May 31, 2009 at 4:10 AM, Sebastiaan Heunis
<address@hidden> wrote:
Ujala
I don't know what you mean by the range of frequencies? I'm guessing
you're just referring to the x-axis labels in Matlab. That would
depend on your sampling frequency after the decimation and the number
of points that you use for the FFT. Let's say your sampling frequency
is 16Msps and you're taking 1s of data for the FFT. Your x-axis will
look as follows:
-16000000/2:1:(16000000/2)-1 or
-samp_freq/2:samp_freq/no_samples:(samp_freq/2)-1
If you get a peak in the middle of your data, then you have a DC
offset somewhere.
Sebastiaan