Description: PNG image
|
| From: | Ashraf Younis |
| Subject: | [Discuss-gnuradio] Fwd: Creating a FFT plot like the one in this youtube variable |
| Date: | Wed, 22 Jul 2015 14:40:16 -0400 |
sure :)
On 22.07.2015 19:45, Ashraf Younis wrote:
Excuse me, it was my mistake.I sent it as an attachment, is that okay?
On Wed, Jul 22, 2015 at 1:29 PM, Marcus Müller <address@hidden> wrote:
Hi Ashraf,
your mail is only 8.5kB large -- did you possibly forgot to include links to the images?
Best regards,
Marcus
On 22.07.2015 19:28, Ashraf Younis wrote:
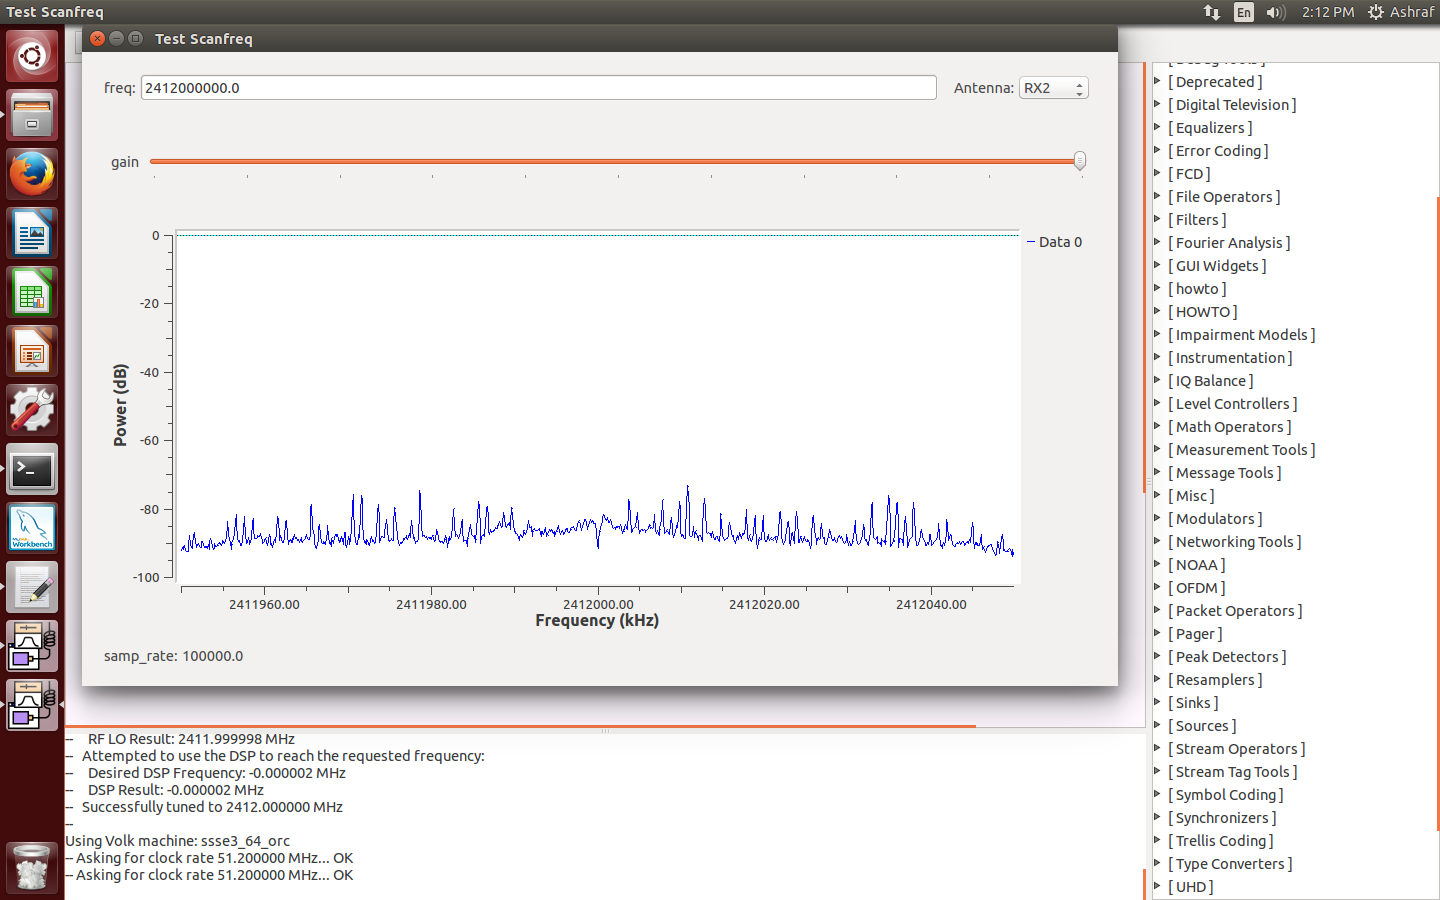
Thank you for replying.I included some screenshots of the program. One is of the block diagram and the other is of the graph itself.I am generating a signal using a different device and program. having only one B200 has prompted me to use this method. I am using a NI USRP-2920 with lab view to generate a signal
On Wed, Jul 22, 2015 at 12:01 PM, Marcus Müller <address@hidden> wrote:
Hi Ashraf,
If you've configured the USRP source correctly, you're very likely actually displaying the spectrum your digital receiver sees -- depending on the signal, you could a) actually be rising the power level in that whole band, or b) maybe you're observing something like saturation and hence intermodulation of additional signals.
You migth want to share what exactly you are observing, and what exactly the signal is you're generating. Screenshots are easy to make and to upload [1], so please illustrate a little better!
Best regards,
Marcus
[1] www.imgur.com
On 22.07.2015 17:56, Ashraf Younis wrote:
Hello, the issue I am having is I cannot display a graph that shows a wide range of frequencies and their power. When I attempt it with the QT GUI Frequency in GRC, I get something similar to the one in this video (FFT plot) but then I transmit a signal in the range I am currently looking at and the whole line moves up. This leads me to believe that I am no displaying the whole range I desire, but in fact I am displaying the center frequency and a small bandwidth around it. I want to, for example, scan the 2.4 GHz range and see all of the channels and their power. And when I transmit at a certain frequency, I see a spike at the spot in the graph.
How do I create that graph?
_______________________________________________
Discuss-gnuradio mailing list
address@hidden
https://lists.gnu.org/mailman/listinfo/discuss-gnuradio
_______________________________________________
Discuss-gnuradio mailing list
address@hidden
https://lists.gnu.org/mailman/listinfo/discuss-gnuradio
![]() graph no signal.png
graph no signal.png
Description: PNG image
![]() graph with signal.png
graph with signal.png
Description: PNG image
| [Prev in Thread] | Current Thread | [Next in Thread] |