On Mon, Oct 26, 2015 at 4:47 PM, Marcus Müller <address@hidden> wrote:
Hi Maksim,
Could you keep this on the mailing list?
I don't fully understand:
> In fact, the figure shows repeated OFDM signal, each of it in frequency domain.
So you take the OFDM signal, and shift it in frequency domain, and then have N identical OFDM signals transmitted at the same time?
Can you clearly state what your X-Axis and what you Y-Axis are?
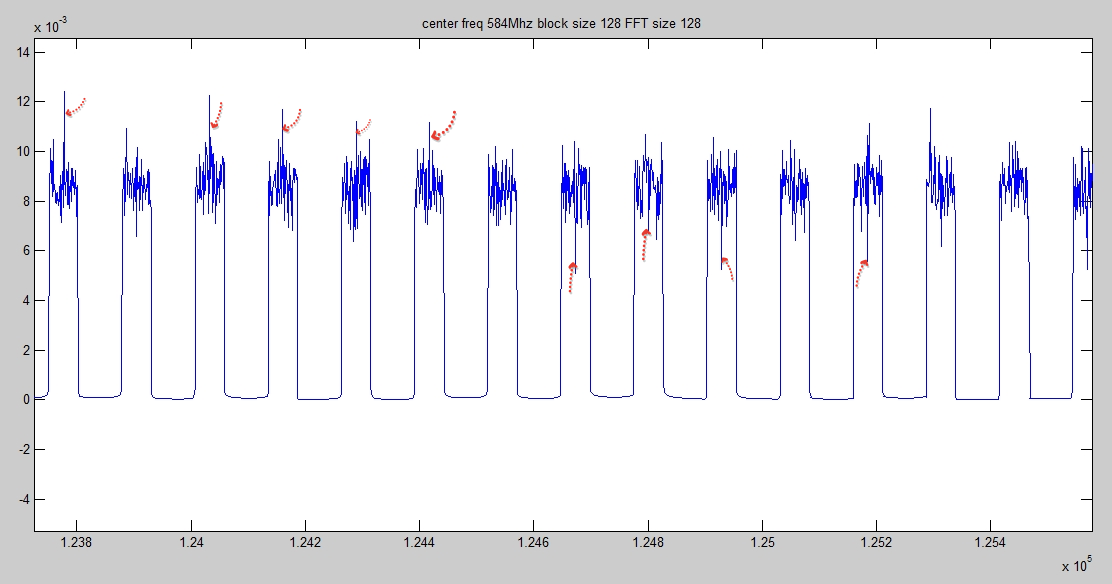
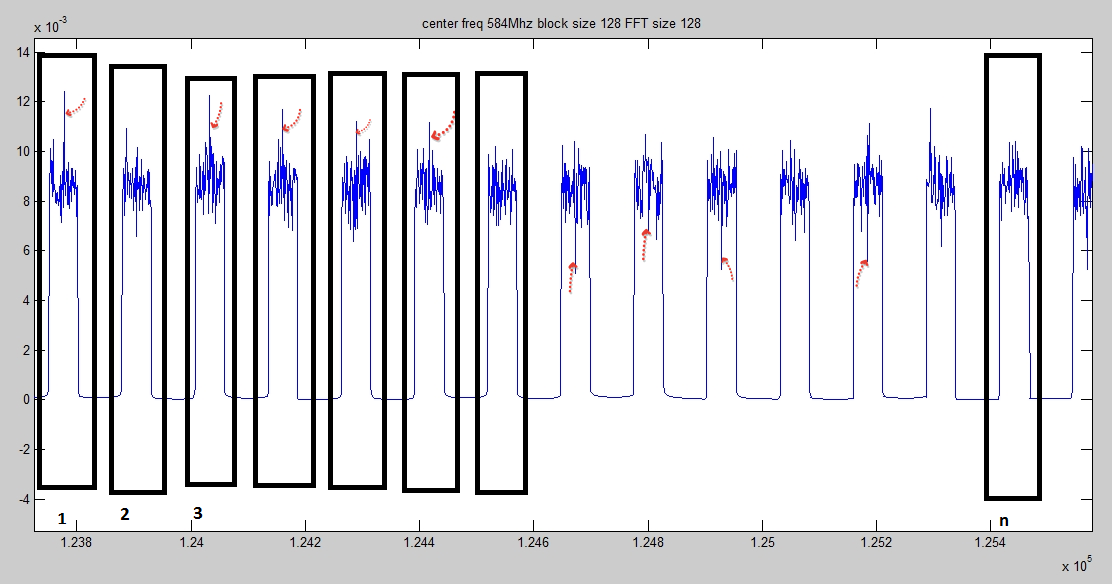
For example, I transmitted a zadoff-chu sequence which has a flat characteristic in frequency domain. The environment was a short cable with attenuation. The received signal also showed in frequency domain.
I attached it also "the figure shows the repeated sequences 2Mhz bandwidth in frequency domain". What I am curious about are spikes which appear usually in the center frequency? I thought may it is related some how with dc offset in USRP.
I don't understand this graph:
What is the X-Axis, what is the Y-Axis?
Maybe you meant that you take values from a Zadoff-Chu sequence, IFFT them, thus generating an OFDM signal (which, by the way, is also a ZC sequence), add guard intervals and transmit them?
I'm really getting intrigued by what you observe :) but we'll really have to understand the graphs, which at this point, I'm afraid, I don't.I attached it also "the figure shows the repeated sequences 2Mhz bandwidth in frequency domain". What I am curious about are spikes which appear usually in the center frequency? I thought may it is related some how with dc offset in USRP.
Best regards,
Marcus