On Jul 4, 2016, at 2:35 PM, Dmitri A. Sergatskov <address@hidden> wrote:
On Mon, Jul 4, 2016 at 12:25 PM, Vic Norton <address@hidden> wrote:
Hi
A slight modification of your script does not work on my El Capitan Octave
(homebrew version 4.0.2). The problem: octave/gnuplot can only draw
dotted grid lines, which are almost impossible to see with the default
0.5 linewidth. Here is a demonstration script.
% test_octave_graphics.m - to demonstrate an octave/gnuplot problem
graphics_toolkit('gnuplot');
x = 0 : 0.1 : 3.5;
y = sin(x);
close all;
figure;
plot(x, y);
axis([0, 3.5, 0, 1.5], "equal");
set(gca, "xgrid", "on", "ygrid", "on", ...
"gridlinestyle", "-", ...
"xtick", [0 : 0.5 : 3.5], ...
"ytick", [0 : 0.5 : 1.5] ...
);
Change the first line to
graphics_toolkit(‘qt’);
and you will see solid grid lines —- as you should.
What kind if terminal your gnuplot is using?
With either qt or x11 terminals I get a reasonably good
looking picture (see attached).
You can select terminal by using
setenv("GNUTERM", "qt")
Regards,
Vic
Dmitri.
--
<Screenshot_from_2016-07-04_13-32-18.png><Screenshot_from_2016-07-04_13-28-15.png>
What is your point, Dmitri? You show two screen shots with dotted gridlines.
My code says to draw solid gridlines:
“gridstyle”, “-“, ...
That is the problem with my octave/gnuplot. It can’t draw solid gridlines.
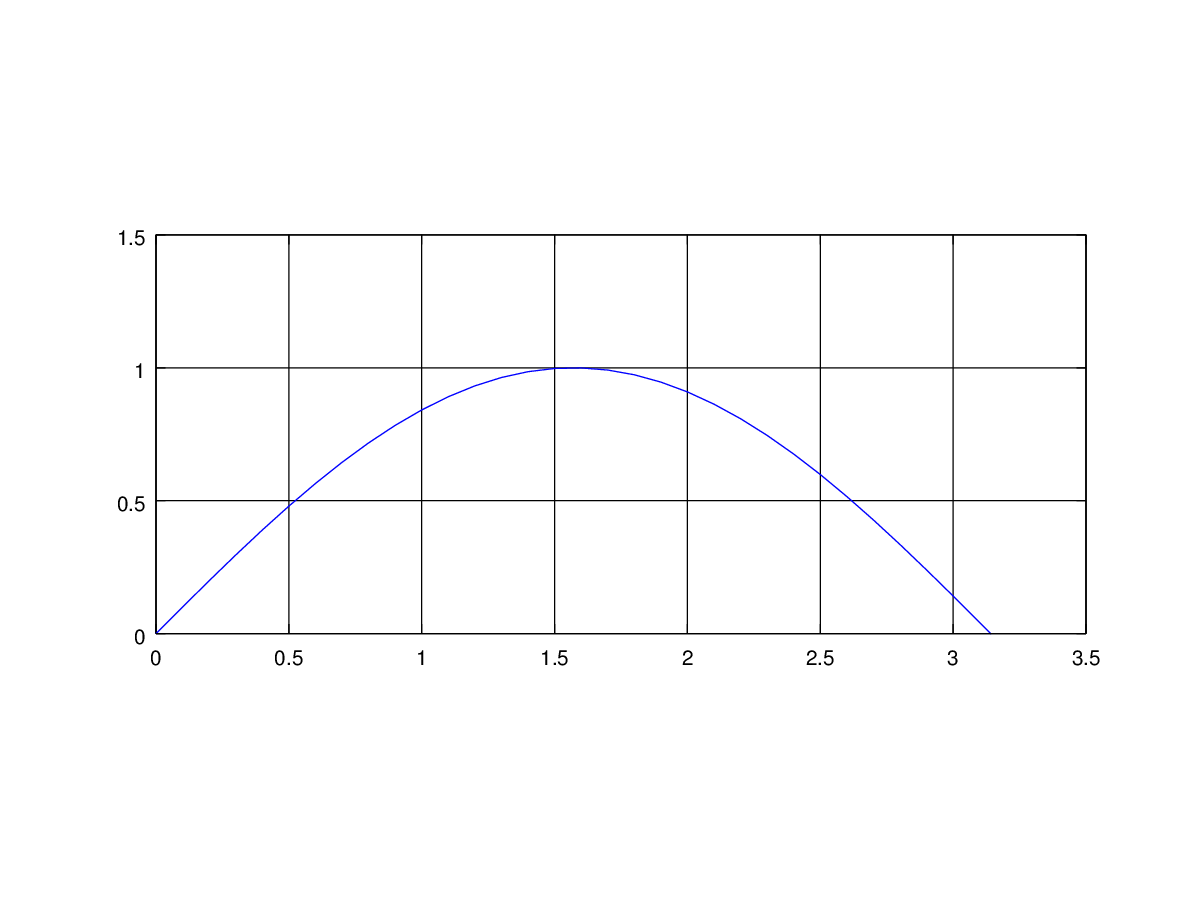
Here is a plot of the above code with the first line changed to
graphics_toolkit(‘qt’).
These are what I call “solid” gridlines.
Regards,
Vic