Hello,
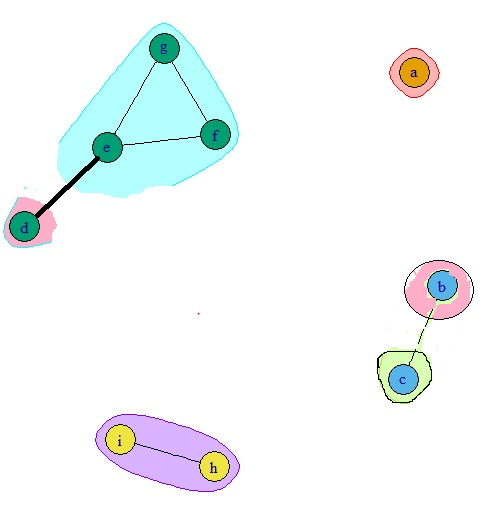
When I plot the values in the matrix using the code below, I get the plot shown in Fig A. I am expecting a plot as in Fig B. What should I do to make the partially self reacting protein between same protein and completely reacting with one or more of the other proteins as a separate bin but attached to the protein(s) of other bin that it is reacting with.
| a | b | c | d | e | f | g | h | i | |
| a | 1 | 0 | 0 | 0 | 0 | 0 | 0 | 0 | 0 |
| b | 0 | 1 | 1 | 0 | 0 | 0 | 0 | 0 | 0 |
| c | 0 | 0 | 0.5 | 0 | 0 | 0 | 0 | 0 | 0 |
| d | 0 | 0 | 0 | 0.5 | 0 | 0 | 0 | 0 | 0 |
| e | 0 | 0 | 0 | 1 | 1 | 1 | 1 | 0 | 0 |
| f | 0 | 0 | 0 | 0 | 1 | 1 | 1 | 0 | 0 |
| g | 0 | 0 | 0 | 0 | 1 | 1 | 1 | 0 | 0 |
| h | 0 | 0 | 0 | 0 | 0 | 0 | 0 | 1 | 1 |
| i | 0 | 0 | 0 | 0 | 0 | 0 | 0 | 1 | 1 |
m <- as.matrix(read.csv("C:/Users/balakrr1/Desktop/csv/n3.csv", header=TRUE, sep = ",", row.names = 1))
g = graph.adjacency(m,mode="undirected",weighted=TRUE)
g=simplify(g, remove.loops=TRUE)
eb=edge.betweenness.community(g,directed=FALSE,weights=E(g)$weight)
fr=layout.fruchterman.reingold(g)
plot(eb,g,layout=fr,edge.width=E(g)$weight,main="Edge Betweenness")
Fig A.
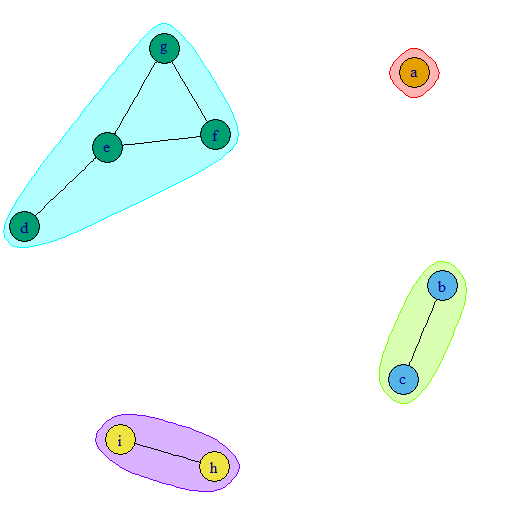
Fig B
Thanks,
Raj