On 01 Mar 2014, at 16:45, admin-at-extremeshok-dot-com <address@hidden> wrote:
Currently m/monit offers a really good charts of the overall system (cpu usage, memory usage, swap usage, etc).
Would it be possible to add per service/process statistics and analytics... ie memory usage graph of nginx for the specific host and all hosts ?
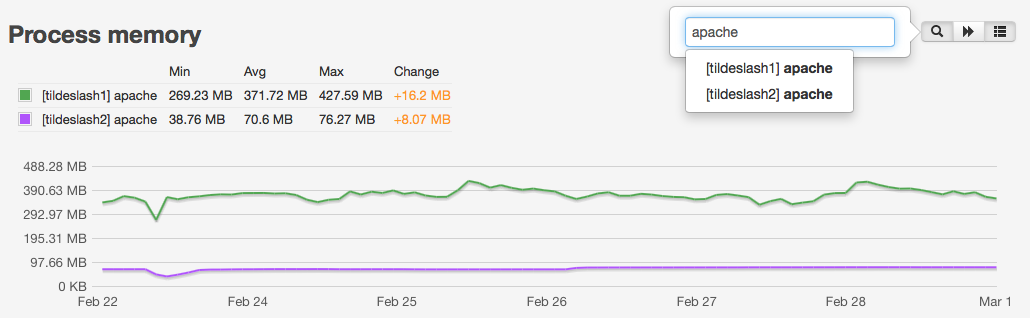
Thanks, have you looked at the Process Memory and CPU charts? With service filtering (in this case apache) and by selecting more than one host when you generate charts you can see something like this:
Is there any way to add more advanced stats and analytics like those compatible with collectd ? https://collectd.org/wiki/index.php/Table_of_Plugins
ie. maybe the monit service could poll collectd and send the stats to m/monit
Im sure most m/monit users would love to know the cache hits/misses of varnish, requests per second of nginx, powerdns requests per second, etc.
Good suggestion, we are looking at ways to push “arbitrary” or user selected data to M/Monit for display in charts. For the next major release we plan to open up the collector or extend the HTTP API (http://mmonit.com/documentation/http-api/Introduction) so user selected data can be pushed to M/Monit and not necessarily only from Monit, but for instance from a script or program you create.