[Date Prev][Date Next][Thread Prev][Thread Next][Date Index][Thread Index]
Loss of minor ticks on log plots
|
From: |
Rik |
|
Subject: |
Loss of minor ticks on log plots |
|
Date: |
Fri, 22 Jan 2010 17:22:10 -0800 |
All,
I'm not sure if this was intended behavior, but the logarithmic ticks on
plots have disappeared. I prefer having the ticks, as the plots more
closely resemble the logarithmic plots I was taught.
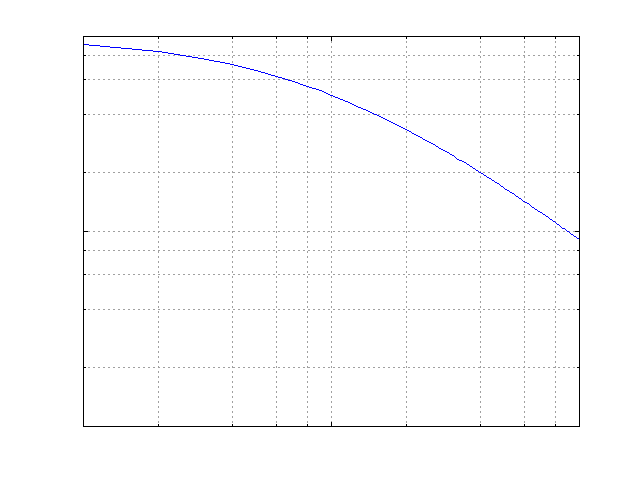
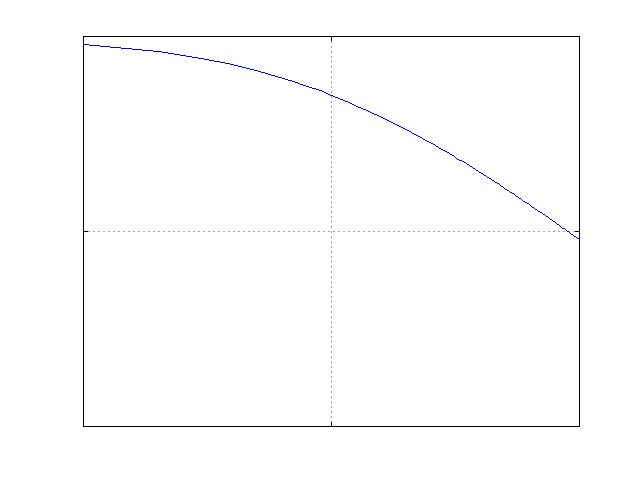
The attached two plots clearly show the difference(I have turned on the
minor grid for emphasis).
The changeset that introduced this issue was 8322, so it is has already
escaped to the 3.2 series.
I used the following code to produce the plots(gnuplot 4.2.5):
x = linspace(0.1,10,100);
y = 1./(1+x);
loglog(x,y);
--Rik
- Loss of minor ticks on log plots,
Rik <=