[Date Prev][Date Next][Thread Prev][Thread Next][Date Index][Thread Index]
multi dimensional data in 2d plot
|
From: |
Levente Torok |
|
Subject: |
multi dimensional data in 2d plot |
|
Date: |
Tue, 16 Feb 2010 18:36:18 +0100 |
Hi all,
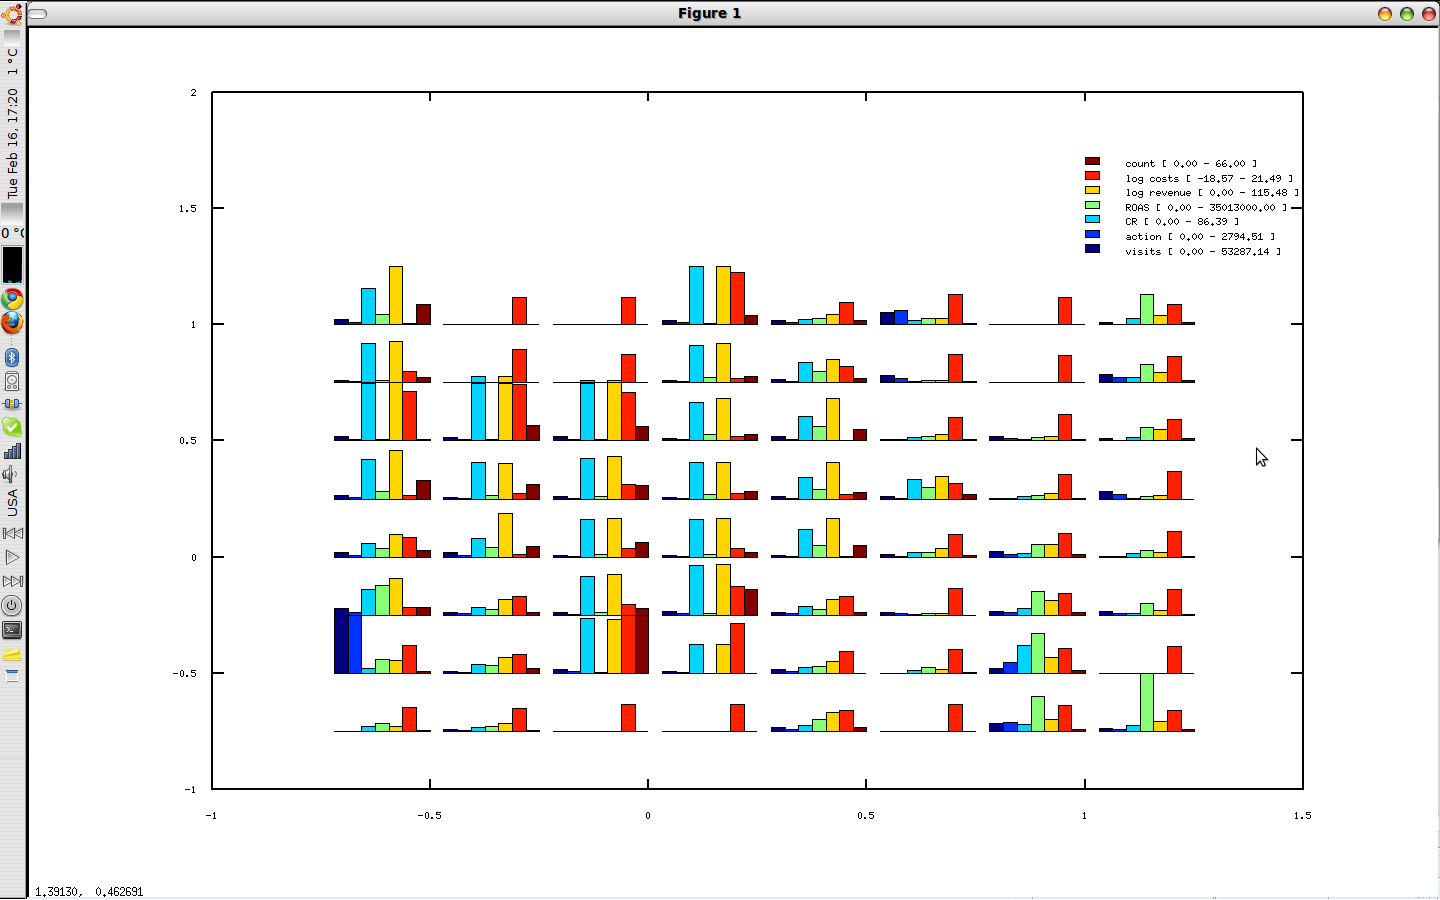
For visualization purposes I used a package called GTM (Generative Topographic Modelling).
The model was developed for matlab (http://www.ncrg.aston.ac.uk/GTM/)
This is meant to project high dimensional data to 2D just like Self Organized Maps but with several advantages.
However to display the data I still needed something so I developed a function called mdimplot .
It creates an image like the one I attached.
Let me know your comments.
Levente
 Screenshot-2.png
Description: PNG image
 mdimplot.m
Description: Text Data
| [Prev in Thread] |
Current Thread |
[Next in Thread] |
- multi dimensional data in 2d plot,
Levente Torok <=