Description: PNG image
|
| From: | Richard |
| Subject: | Re: Sample Matlab profiler output |
| Date: | Fri, 15 Jul 2011 11:36:08 +0100 |
| User-agent: | Mozilla/5.0 (Windows; U; Windows NT 6.1; en-GB; rv:1.9.2.18) Gecko/20110616 Thunderbird/3.1.11 |
On 14/07/2011 18:55, Daniel Kraft wrote:
-----BEGIN PGP SIGNED MESSAGE-----
Hash: SHA1

On 07/14/11 19:24, Jordi Gutiérrez Hermoso wrote:
> From asking around in ##matlab in IRC, someone helpfully offered the following profiler output from Matlab: http://jordi.platinum.linux.pl/octave/matlab-profiler-output.tar.gz Note that it also produces HTML output, but we can worry about that at the very last or perhaps even after the GSoC project. We certainly don't need to produce identical HTML output. The .mat is in two formats, but I think Octave can only load stuff-v7.mat, or else I'm doing something wrong with my Octave build.Thanks! From the documentation, it seems that 'profile' doesn't even generate any 'human usable' output itself; just a structure of profiling data, similarly to what profiler_data in my last patch does. The HTML is seemingly generated by profsave, but if you think so we can very well delay implementing this function until later. Currently I'm working on implementing parts of 'profile', and later I'll try to add missing backend information like number of calls to a function, whether it is recursive or not and the child/parent functions. That seems to be straight-forward and easy to do. In order to generate useful output even without profsave, what do you think about extending either profile via, e.g., profile('print') to print a flat-profile as ASCII table of the hottest functions? (Possibly with number of functions to print specifiable as argument)? That's exactly the sort of output I would probably expect and use most often, but I'm also using gprof on the command-line. Or maybe it would be nicer to leave the 'profile' function the way it is, and add 'profshow' to do the job? The workflow would then be something like: profile on; ...do something... profile off; data = profile ('info'); profshow (data); What do you (and the others) think about that? Or is there even a Matlab interface that does neither print HTML nor use the GUI, which we could try to replicate? I didn't find one. Yours, Daniel PS: Right now, my .m file is in "scripts/general". Is this ok? Or should we create possibly a dedicated directory for the profiler, which would later contain profile, profshow, profsave and possibly other routines for other output formats (if we don't use profsave for that purpose)?- -- OpenPGP: 3BA2 3DDB 7758 F010 BDAB 0DCF 527E 79BA A3B5 3998- -- Done: Arc-Bar-Cav-Kni-Ran-Rog-Sam-Tou-Val-Wiz To go: Hea-Mon-Pri -----BEGIN PGP SIGNATURE----- Version: GnuPG v2.0.17 (GNU/Linux) Comment: Using GnuPG with Mozilla - http://enigmail.mozdev.org/ iQIcBAEBAgAGBQJOHy2RAAoJEFJ+ebqjtTmY60MQAKq0lHwVNm/O9fb1HX/JG9DB wA62LwvojaOqJxIg89u6KDsjxU0/8Hhn3SE7hp4KIc/o2tt5c2kTudfHwNV+vzMP EMR+FjUYZMhcvAReacVWNFC7eVkqcwkTao81uumkEv7g8mAAfZIZu908zWrPdNUr Wws3Wgk1wOrKZQuhNAohC31D2XbxUOcB6iY+O6ybrrrfz5zowjDjzrOhYs1MgFRX QSsEeuNScs7ZDjroSsoCp7NdG2lvP9joB6t0okqromRYIdmRpZ0FJhK2Z4L3PCO+ jKGXTOs/9SzfqIrYI5DNoPAkmxwnexoSJBm2Wf+h8aScOEXtlLaczXye09QZ3NHU w1jUdOIuPxiikZKqyN2Irs/mCTQb97RahL9EnIzryrr3MyPgtg7MsBF8r3z2sNO1 JhwzHVJBf9CPQ9LtGh0sChx1/iTssPMSVL63Rs/swmeVUmZW6F3YrMa6syPf3mNX rIyXMIh6cJfCz257SjW1BCfEhFNy+/p1J666MGoyeya5iArnJP0OPSZadkaxGgoP HlpOqBNfthw5Vq5qb1o3yLsTe7JL60KB2c5LKBmufcbz66J3jtApD6EbSxtLVvII YmRb7ooesXCrCscrB/Pz/KcqPjGJ2JgcN3zobEjrk5ZVMUbbT6QmBWg3Y4/itViv PL13NVPirA73fhI4EHvS =aZFb -----END PGP SIGNATURE-----
Apologies if everything I'm about the state is already known, but in case it isn't...
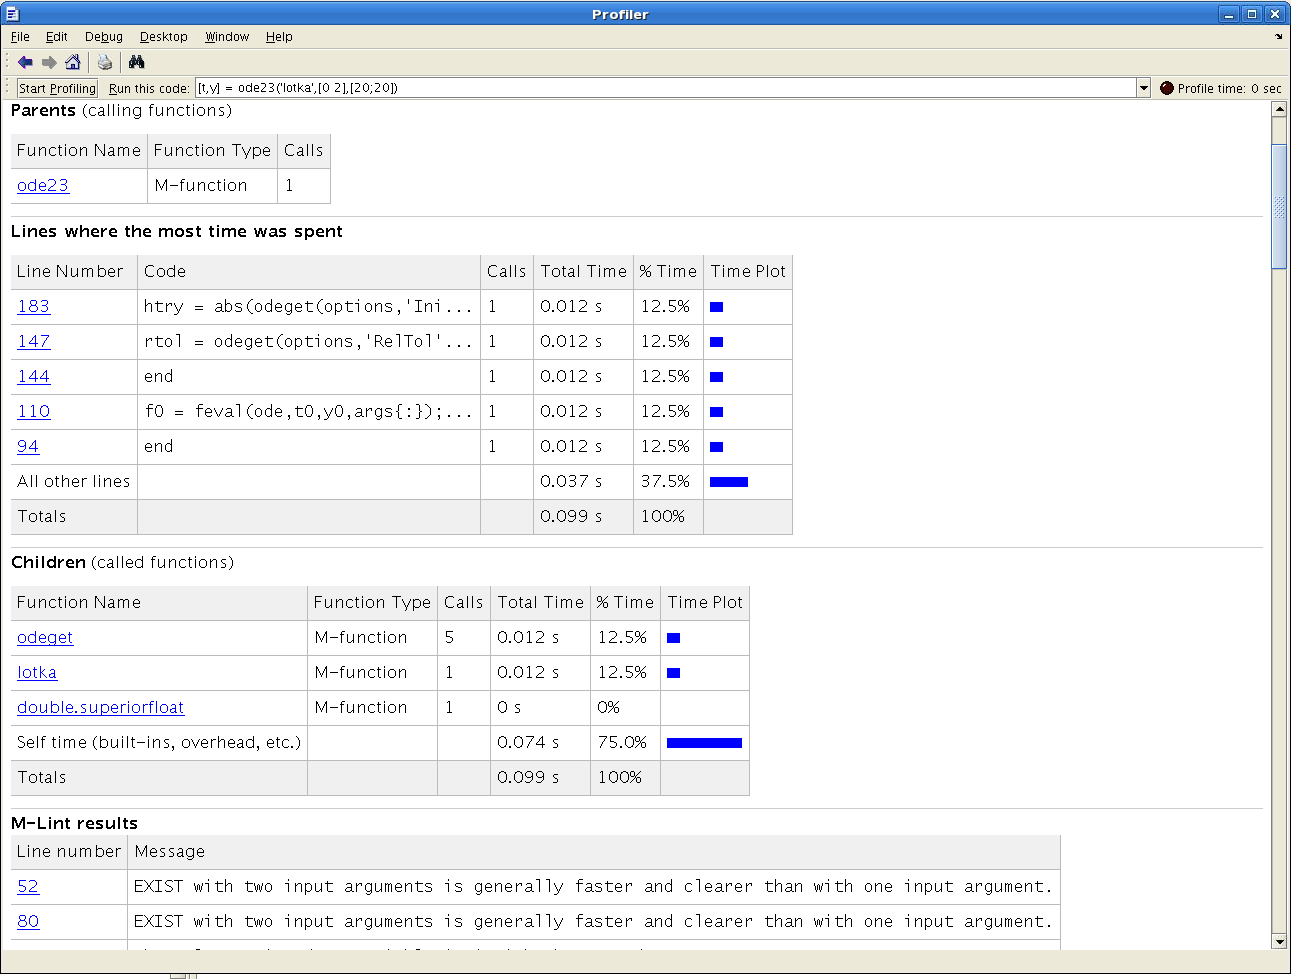
When you use the profiler in Matlab it is generally done through a standalone GUI which calls profile for you.
There is a box where you can paste the code to be profiled, e.g. a function with some arguments, or a script file name etc.
This GUI then loads the html output from profile and presents it as a sort of browsable website. At the top level page is a list of the functions called and a description of the time spent in each function broken down into total time and self time, i.e. the time spent executing statements in that function as opposed to time spent in subfunctions.
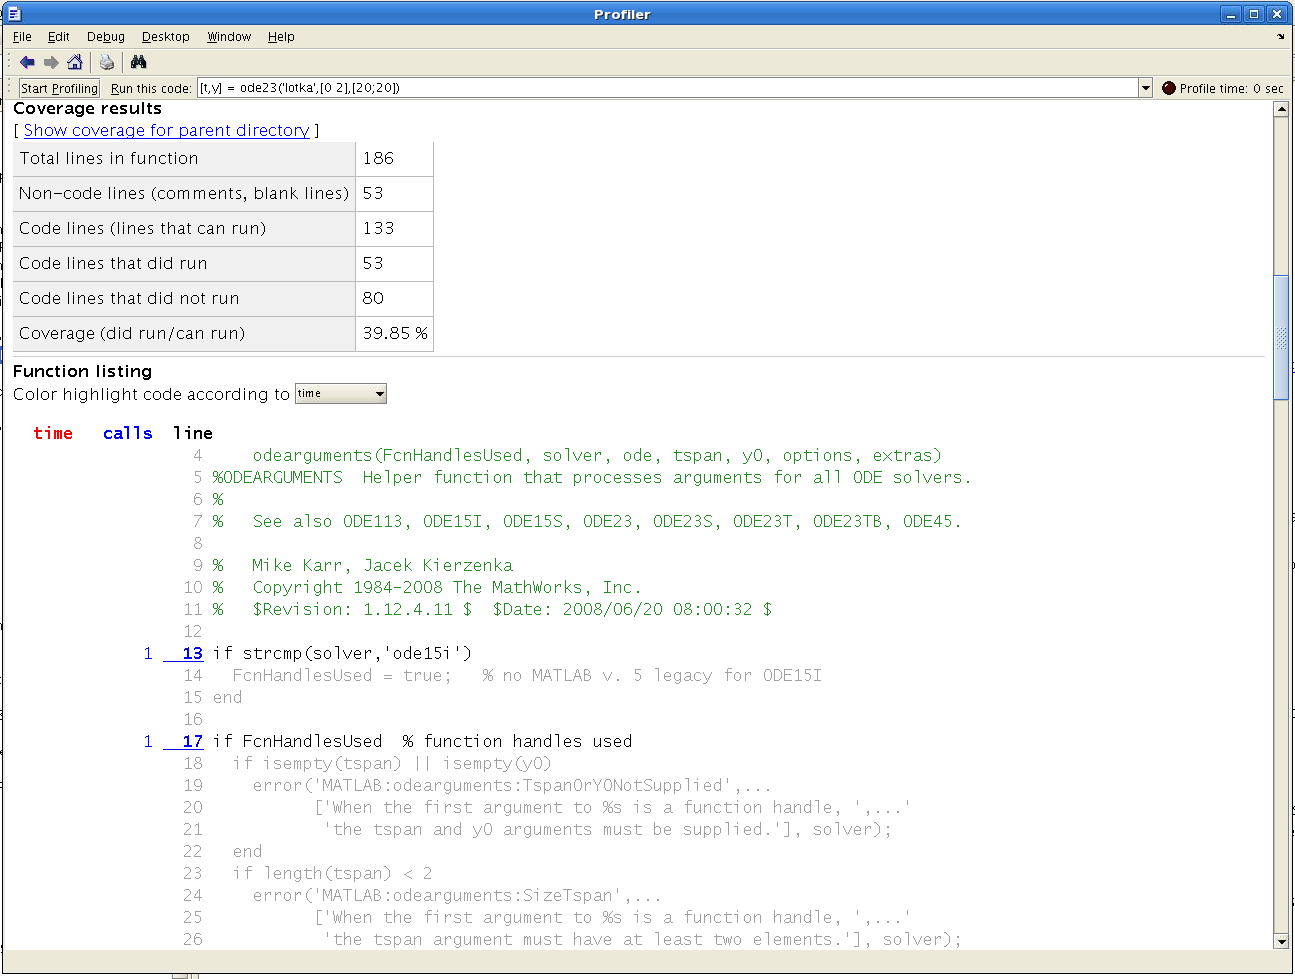
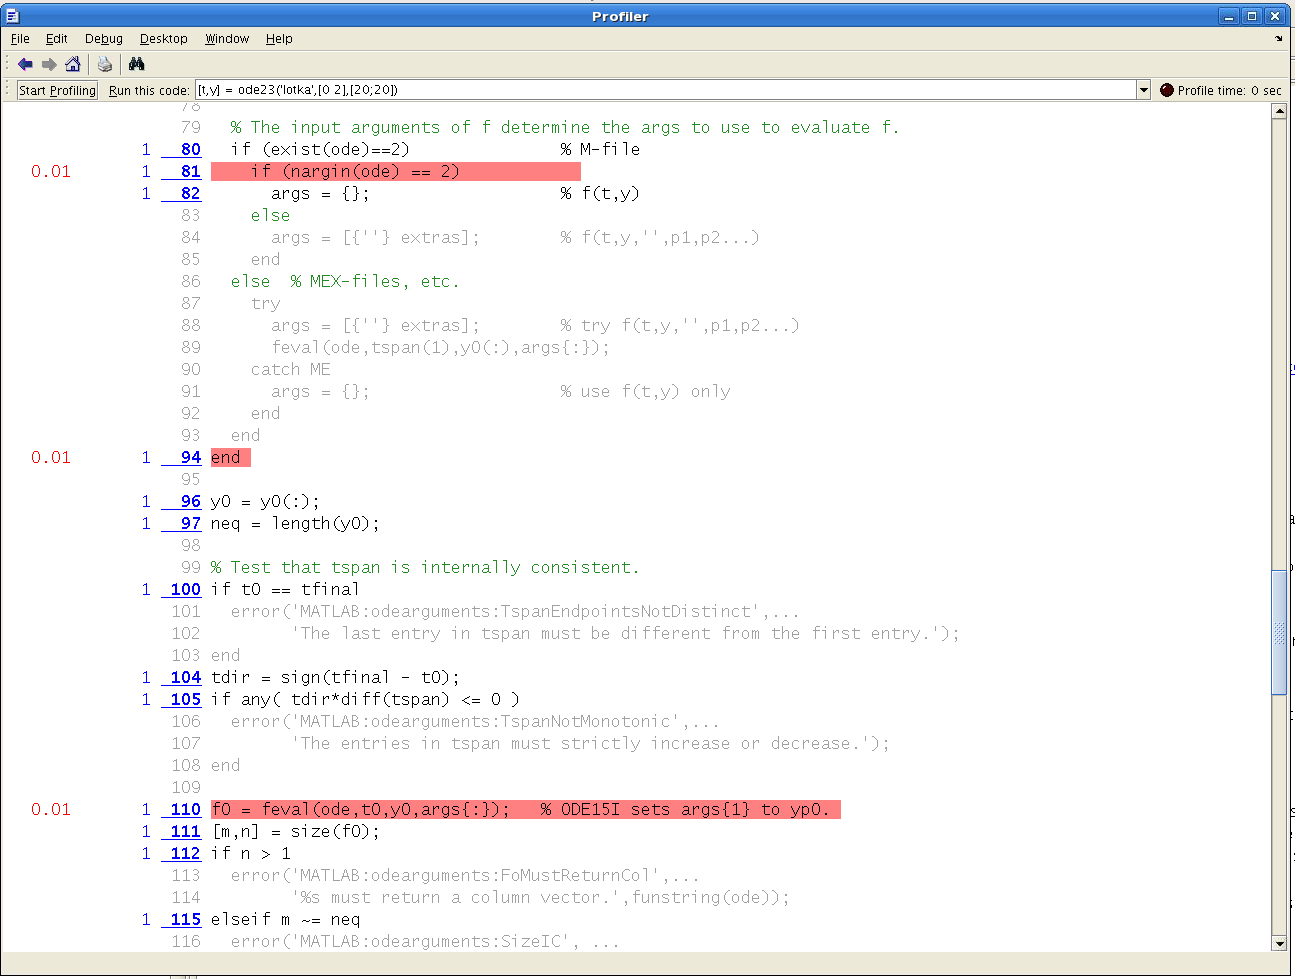
You can then click on links to child functions which takes you to a page with info similar to the top level output for that function, then below this, the function file is displayed with various pieces of information added such as the time spent on each line, and the most heavily used lines highlighted in red, unused lines greyed out etc. You can also click on the function line to open to that line in the matlab editor.
I've attached some screenshots of this, but the following links:

http://www.mathworks.com/help/techdoc/matlab_env/f9-17018.html

http://www.mathworks.com/help/techdoc/matlab_env/f9-17018.html#f9-17206

and

http://www.mathworks.com/help/techdoc/matlab_env/f9-17018.html#f9-26561

contain more info and images.

To get the output you can call profile with 'info' according to the manual
personally I would leave profile as it is (since one of aims of octave is to match the matlab syntax in most cases) and have a separate function do the text display, or alternatively add an option to profshow. If doing a text display I would consider having an option of a text file to output to, as the results could be a hell of a lot of text to display in the output window in many cases.
Richard


--
The University of Edinburgh is a charitable body, registered in
Scotland, with registration number SC005336.
![]() function_output.png
function_output.png
Description: PNG image
![]() function_output_2.png
function_output_2.png
Description: PNG image
![]() function_output_3.png
function_output_3.png
Description: PNG image
| [Prev in Thread] | Current Thread | [Next in Thread] |