Description: PNG image
|
| From: | Patrick Noffke |
| Subject: | Re: Google Summer of Code - LaTeX processing |
| Date: | Fri, 7 Jun 2013 10:37:42 -0500 |
On Fri, Jun 7, 2013 at 7:29 AM, Ben Abbott <address@hidden> wrote:
> On Jun 7, 2013, at 7:10 PM, Michael Goffioul wrote:
>
>> On Fri, Jun 7, 2013 at 4:48 AM, Andrej Lojdl <address@hidden> wrote:
>>
>>> 2013/6/7 Abbott, Ben <address@hidden>
>>>
>>>> On Jun 6, 2013, at 11:13 PM, Patrick Noffke wrote:
>>>>
>>>>> On Wed, Jun 5, 2013 at 2:57 PM, Andrej Lojdl <address@hidden> wrote:
>>>>>> Today I had more time, so I started reading the code and thinking how to
>>>>>> control multiline high as Michael proposed. There are some things bugging
>>>>>> me... I understand that height is expressed in font size and that 64 is
>>>>>> some
>>>>>> scaling factor between font size and size of character on screen. And
>>>>>> that
>>>>>> we save line high in font size (it is expressed in font size). But I
>>>>>> don't
>>>>>> understand how to add this scaling factor? Can someone give me a hint or
>>>>>> example? When make plot and add title typing title (" text \n text \n
>>>>>> text
>>>>>> \n"), it makes two lines and then, just pack all new lines to second. If
>>>>>> I
>>>>>> get it, this is what needs to be repaired. Is function called once for
>>>>>> every
>>>>>> line or for whole string?
>>>>>
>>>>> I was just playing around, and I think the problem is more than with
>>>>> multi-line text.
>>>>>
>>>>> figure;plot(x,y);title(sprintf('Line 1\nLine 2\nLine 3'), 'FontSize', 24)
>>>>> - The lines are drawn somewhat on top of one another.
>>>>>
>>>>> figure;plot(x,y);title(sprintf('Line 1\nLine 2\nLine 3'), 'FontSize', 10)
>>>>
>>>> Pardon the intrusion, I've been trying to follow along.
>>>>
>>>> I'm not sure what you mean by "somewhat on top of one another". I tried
>>>> ...
>>>>
>>>> title ("Line 1\nLine 2\nLine 3", "FontSize", 20)
>>>>
>>>> and
>>>>
>>>> title ({"Line 1", "Line 2", "Line 3"}, "FontSize", 20)
>>>>
>>>> Both give the result attached, which looks correct to me.
>>>>
>>>> Ben
>>>
>>> When I use "fltk" (OpenGL) as a graphic toolkit i get overlap for size 20
>>> and no overlap for size 36. And same results using "gnuplot".
>>>
>>> 2013/6/7 Catalin Codreanu <address@hidden>
>>> On windows with graphics_toolkit => gnuplot I get this king of image :
>>> I guess that's what Patrick means by "somewhat on top of one another".
>>> I cheated a little bit, my command line was : title({'line 1', 'line2',
>>> 'line 3'}, 'FontSize', 36) ... so that the effect is clear.
>>>
>>> Cat
>>
>> Andrej, Catalin, please try to bottom-post your answers. I know that gmail
>> interface doesn't make it easy (I'm also using it), but it's possible. In
>> the reply window, click the small icon with 3 dots to expand the quoted
>> part, then add your response at the bottom.
>>
>> For the actual issue, I'm wondering whether it could be due to invalid
>> metrics in the font. Could you check whether it's also font dependent?
>>
>> Michael.
>
> Also, Octave has no way to determine the text extents when using gnuplot.
> Also, when the axes activepositionproperty is "outerposition", we have no way
> of determining the extents of the axes plot box. Hence, I don't think we
> should bother trying to implement LaTeX for the gnuplot toolkit.
>
> Ben
>
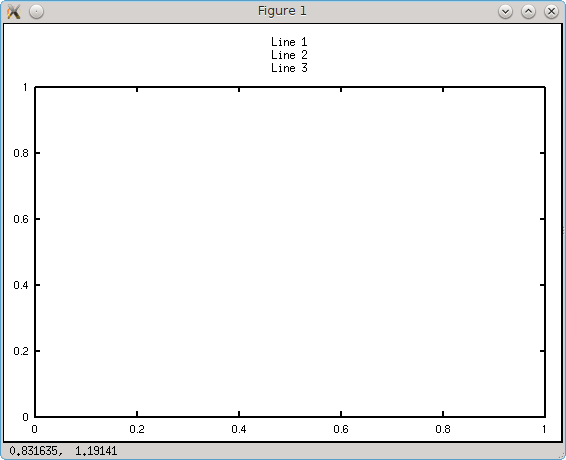
The problem definitely seems to be with gnuplot, and fltk looks fine to me.
Andrej, your figures are gnuplot. Use the graphics_toolkit command to
switch between fltk or gnuplot. See also available_graphics_toolkits.
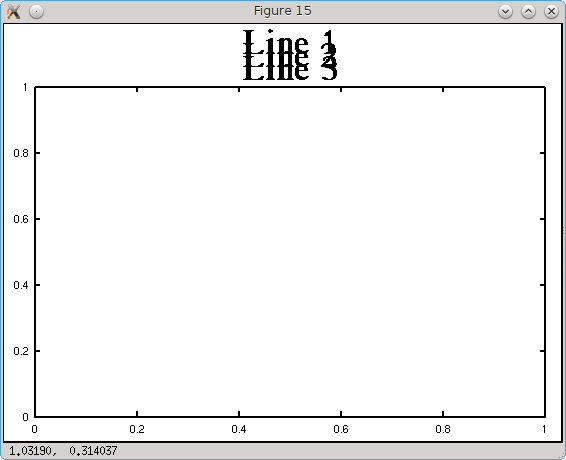
Note that your 36 pt example is not actually 36 pt. On my system,
with gnuplot and above 25 pt with the default font, the font appears
to revert to 13 pt. If I switch the fontname to 'Times', 36 pt font
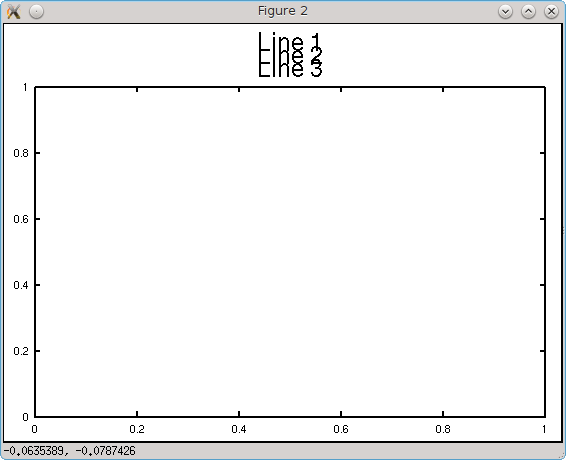
comes out as 36 pt, but the lines are then overlaying.
Some example plots are attached.
fltk:
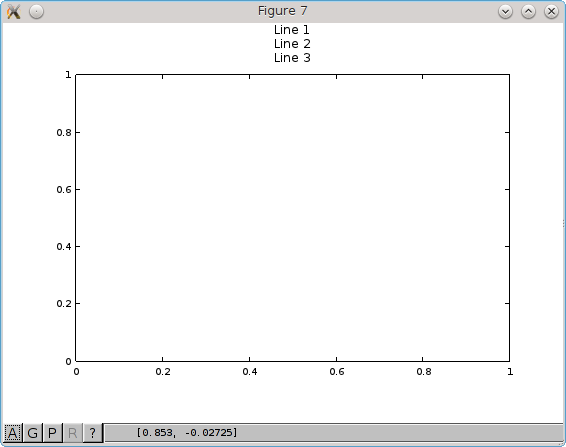
figure;title(sprintf('Line 1\nLine 2\nLine 3'), 'FontSize', 12) ->
fltk_default_12.png
figure;title(sprintf('Line 1\nLine 2\nLine 3'), 'FontSize', 24) ->
fltk_default_24.png
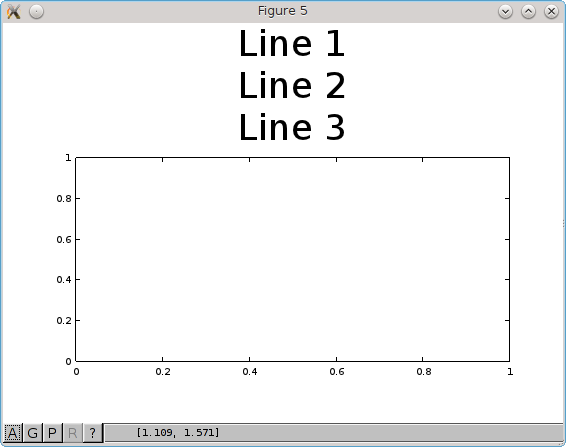
figure;title(sprintf('Line 1\nLine 2\nLine 3'), 'FontSize', 36) ->
fltk_default_36.png
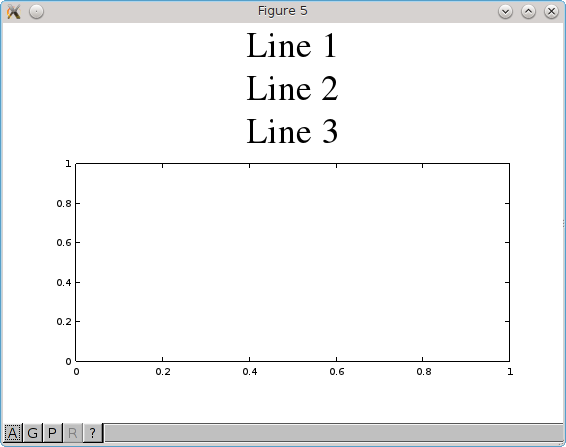
figure;title(sprintf('Line 1\nLine 2\nLine 3'), 'FontSize', 36,
'FontName', 'Times') -> fltk_times_36.png
gnuplot:
figure;title(sprintf('Line 1\nLine 2\nLine 3'), 'FontSize', 12) ->
gnuplot_default_12.png
figure;title(sprintf('Line 1\nLine 2\nLine 3'), 'FontSize', 24) ->
gnuplot_default_24.png
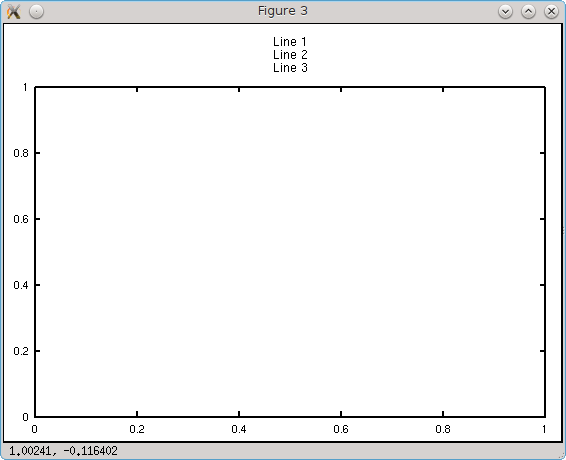
figure;title(sprintf('Line 1\nLine 2\nLine 3'), 'FontSize', 36) ->
gnuplot_default_36.png
figure;title(sprintf('Line 1\nLine 2\nLine 3'), 'FontSize', 12,
'FontName', 'Times') -> gnuplot_times_12.png
figure;title(sprintf('Line 1\nLine 2\nLine 3'), 'FontSize', 36,
'FontName', 'Times') -> gnuplot_times_36.png
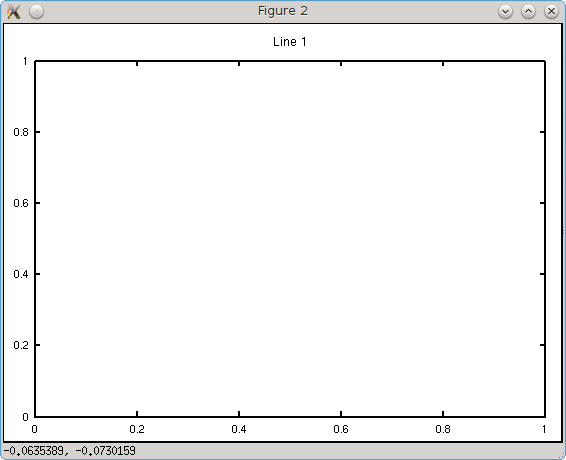
figure;title('Line 1', 'FontSize', 12) -> gnuplot_default_12_one_line.png
Note that all the gnuplot examples have exactly the same height
allocated for three lines of text (regardless of font name or size).
But there is a different height if you use one line vs. three. Where
in the code does the height get set for gnuplot?
Also, with both gnuplot and fltk, I get this result for the fontname:
figure;h = title('Line 1');get(h, 'FontName')
ans = *
figure;h = title('Line 1', 'FontName', 'Times');get(h, 'FontName')
ans = Times
Why do I get '*' for the default fontname, or how can I determine what
font is being used?
Pat
![]() fltk_default_12.png
fltk_default_12.png
Description: PNG image
![]() fltk_default_24.png
fltk_default_24.png
Description: PNG image
![]() fltk_default_36.png
fltk_default_36.png
Description: PNG image
![]() fltk_times_36.png
fltk_times_36.png
Description: PNG image
![]() gnuplot_default_12.png
gnuplot_default_12.png
Description: PNG image
![]() gnuplot_default_24.png
gnuplot_default_24.png
Description: PNG image
![]() gnuplot_default_36.png
gnuplot_default_36.png
Description: PNG image
![]() gnuplot_times_12.png
gnuplot_times_12.png
Description: PNG image
![]() gnuplot_times_36.png
gnuplot_times_36.png
Description: PNG image
![]() gnuplot_default_12_one_line.png
gnuplot_default_12_one_line.png
Description: PNG image
| [Prev in Thread] | Current Thread | [Next in Thread] |