Description: JPEG image
|
| From: | Brij Mohan Lal Srivastava |
| Subject: | Re: Request for Matlab test |
| Date: | Tue, 3 Mar 2015 03:02:07 +0530 |
Hi,
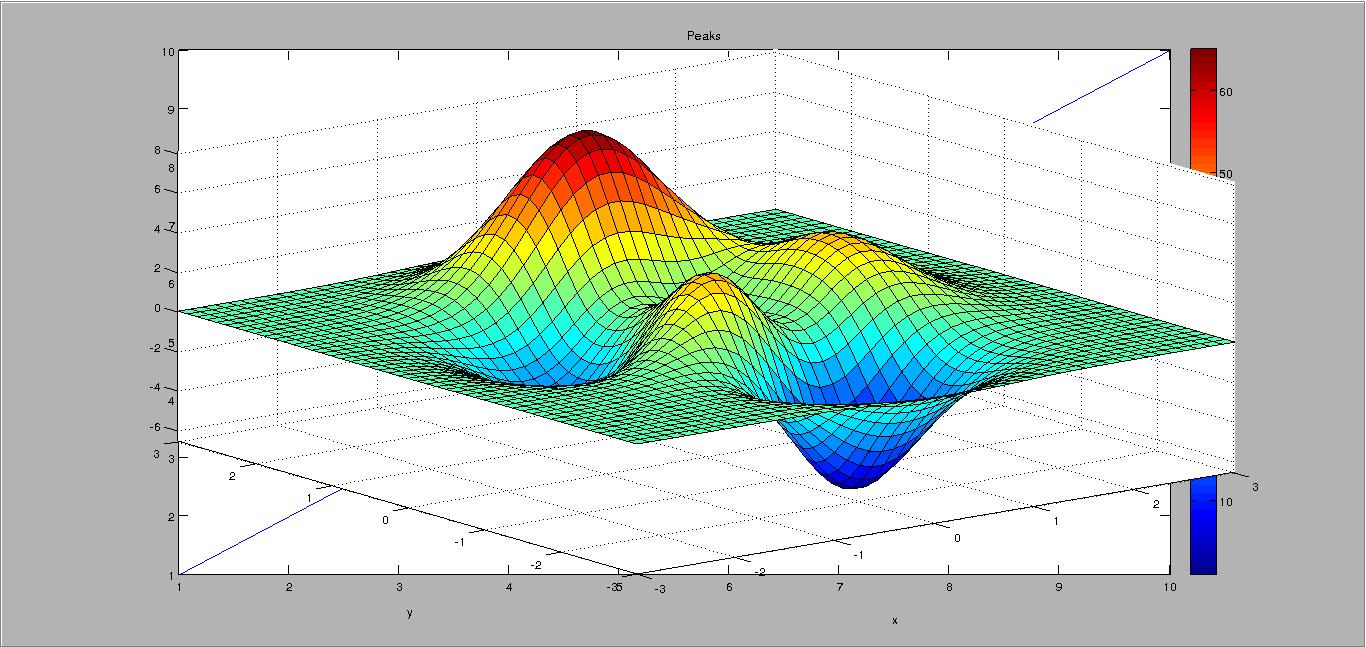
I would like to know how Matlab handles uipanels and their axes children. Can someone run the following in Matlab?
--------------------------------------------
hf = figure ();
hax = axes (); plot (1:10)
hu = uipanel ();
get (hu, 'position')
%% Is the uipanel drawn above/below the axes?
set (hax, 'parent', hu)
hc = colorbar ();
hax2 = axes (); peaks ()
%% Is the last axes drawn above/below the uipanel?
set (hax2, 'parent', hu)
ch = get (hu, 'children');
ch == hax
ch == hax2
axes (hax1);
ch = get (hu, 'children');
ch == hax
ch == hax2
axes (hax2);
ch = get (hu, 'children');
ch == hax
ch == hax2
--------------------------------------------
Thanks in advance,
Pantxo
![]() oc.jpg
oc.jpg
Description: JPEG image
| [Prev in Thread] | Current Thread | [Next in Thread] |