Description: PNG image
|
| From: | Nicholas Jankowski |
| Subject: | Re: Subplot excluded when there is overlap |
| Date: | Mon, 13 Mar 2017 12:25:14 -0400 |
On Mon, Mar 13, 2017 at 2:12 AM, Rik <address@hidden> wrote:
>
> On 03/12/2017 06:33 AM, address@hidden wrote:
>
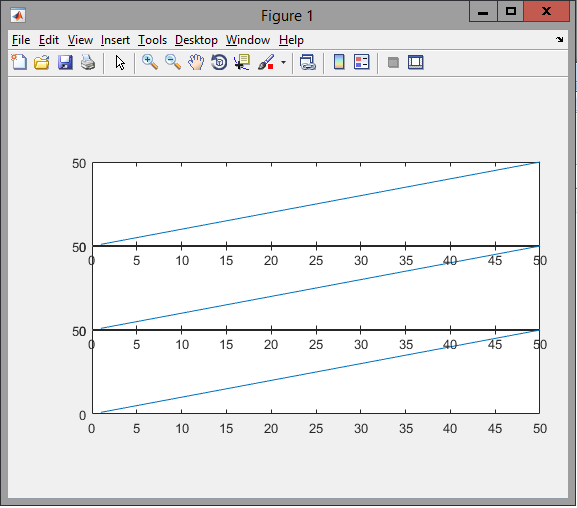
> figure
> subplot('position', [0.15 0.2 0.8 0.2])
> plot(1:50)
>
> subplot('position', [0.15 0.4 0.8 0.2])
> plot(1:50)
>
> subplot('position', [0.15 0.6 0.8 0.2])
> plot(1:50)
>
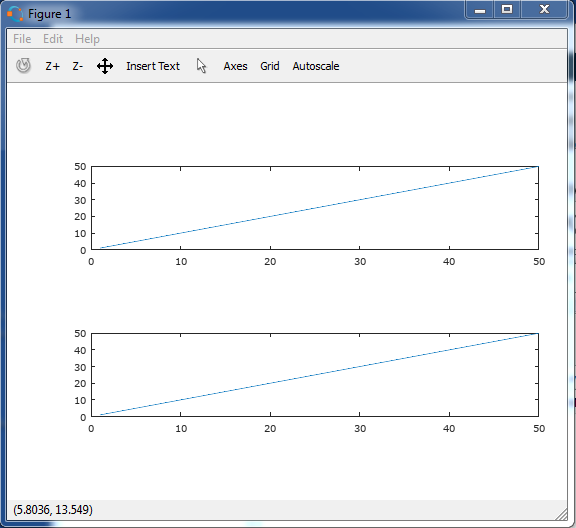
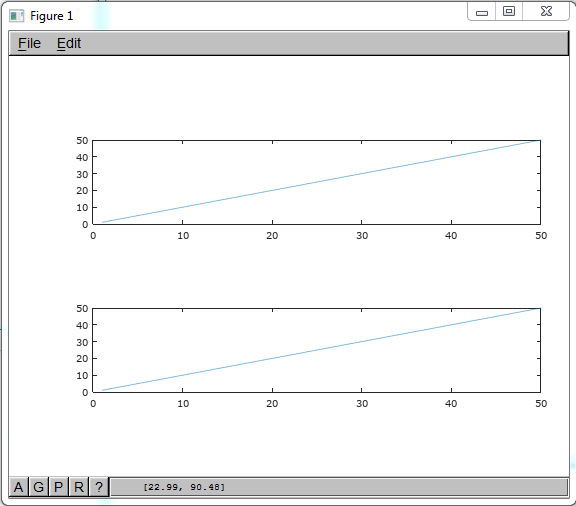
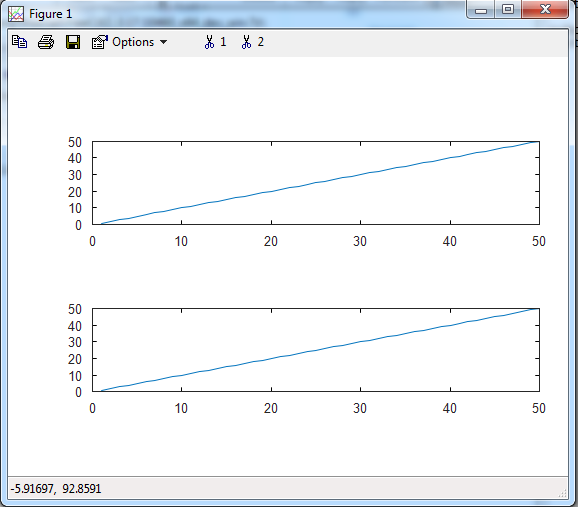
FYI, from a graphics output compatibility point of view. Matlab R2016b
displays all three plots with the above commands, while Octave loses
the middle one. not that I expected one, but no difference with diff
graphics_toolkits. screencaps attached. Not sure if that's enough to
make it bug report worthy.
![]() Matlab2016b.PNG
Matlab2016b.PNG
Description: PNG image
![]() Octave4.2.1_QT.PNG
Octave4.2.1_QT.PNG
Description: PNG image
![]() Octave4.2.1_fltk.PNG
Octave4.2.1_fltk.PNG
Description: PNG image
![]() Octave4.2.1_gnuplot.PNG
Octave4.2.1_gnuplot.PNG
Description: PNG image
| [Prev in Thread] | Current Thread | [Next in Thread] |