|
| From: | Stefan Nürnberger |
| Subject: | [Qemu-devel] Bug with 32-bit segmentation |
| Date: | Fri, 14 Mar 2008 22:40:28 +0100 |
| User-agent: | Thunderbird 2.0.0.12 (X11/20080227) |
|
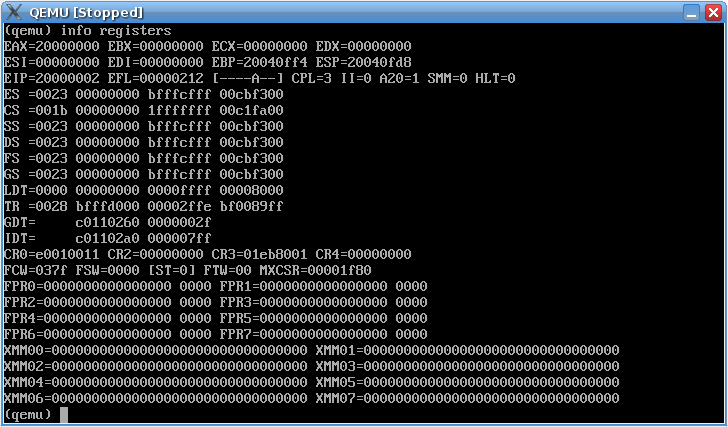
Hi, before talking about the bad things, I have to remark, that qemu is a great program. I like it for it's simplicity and I cherish the integrated gdb-stub, wich avoided a lot of headaches in my early kernel-develpment phase, when no own serial debugger stub existed. And secondly, I hope this is the right place to post bug reports, but I couldn't find an appropriate place. The forum seemed more "user oriented". Unfortunately I encountered a little error when experimenting with segmentation. I'm talking about the x86 version of qemu (0.9.1 soft-mmu). I set up a code segment in the GDT from 0x00000000 to 0x1ffffffff. The data segment ranges from 0x00000000 to 0xbfffcfff. All the stack for instance is allocated behind 0x20000000 - thus after the code segment. Then I tried to execute the stack, to test some security features that this segmentation model should provide in spite of lacking a hardware NX-bit for example. But unfortunately a "jmp"-instruction to an address > 0x1fffffff didn't raise a #GPF, wich shouldn't be possible, I think. I also tested the code on real hardware (AMD Athlon 64, Athlon XP) as well as in VMware. On the these three machines it worked correctly - so, as expected. This error doesn't always occur. Sometimes I get the "wanted" #GPF in qemu, but - as I already said - sometimes not. To investigate I did the following: I modified the demo program to execute the intentionally stored instructions on the stack several times in a for-loop (see the attached file for details). The #GPF I was waiting for then raised after executing the stack the 47th time, the 582th or the 200th time...etc. No real pattern. But sometimes, as wanted and expected, the first time. Another thing that's strange about this, is, that a GPF will be raised correctly when stepping through the code via the integrated gdb-stub of qemu and an attached gdb. So there wasn't really a way to determine why it wouldn't work. I've also attached a screenshot showing the "show registers" on the qemu console. As you can see the EIP is > GDT[CS]. BTW. don't worry abount the includes in the attached c-file. This file is designed for another OS. But this this shouldn't matter as it's only to get an impression of the code. If you have any further questions, feel free to cantact me. Best regards, Stefan |
#include <raykernel.h>
#include <kdisplay/kprintf.h>
#include <tdm/io.h>

// x86 instructions : nop, nop, nop, ret
unsigned char stack_instructions[] = {0x90, 0x90, 0x90, 0xc3};


RAYENTRY KernelModuleEntry(char *arguments) {

        KPrintf("Starting stack execution test...\n");
        __asm__ __volatile__ ("call *%0\n": : "r"(stack_instructions));

        KPrintf ("This shouldnt happen!");
        exit(-2);
}
| [Prev in Thread] | Current Thread | [Next in Thread] |