Hi—
I am using PSPP 1.5.3 on Windows 10 (in the Spanish language) and found 2 possible bugs:
- Selecting, from the menu: | Analizar | Estadística Descriptiva | Tablas Cruzadas | [selecting categorical variables for Column: ‘color’ and Row: ‘sitio’] | OK | gives only the following result (no tables or statistics):
CROSSTABS
    /TABLES= color BY     sitio

3.31-3.35: error: CROSSTABS: Error de sintaxis en `PIVOT'.

 /FORMAT=AVALUE TABLES PIVOT
    /STATISTICS=CHISQ
    /CELLS=COUNT ROW COLUMN TOTAL.
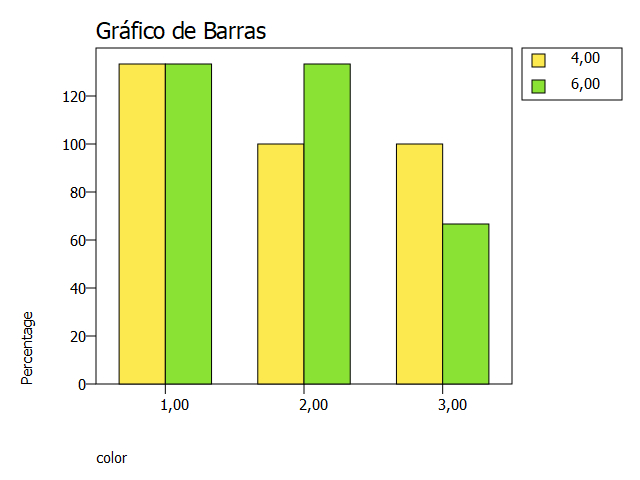
- Selecting, from the menu: | Gráficos| Gráfico de Barras | Tablas Cruzadas | [selecting categorical variables for Eje de categorías: C and Agrupación Categórica: S] | Selecting “% de casos” | OK | gives the following result and a barplot. But, the scale for % goes up to 130% when it should go only up to about 65%. Also, the bars do not appear at the same vertical scale, since they should add up to 100%. The result does not change using other datasets with character values or category names.
GRAPH /BAR = PCT BY color BY sitio.
Víctor González Fernández
