On 29 Apr 2014, at 23:47, Rik <address@hidden> wrote:
4/29/14
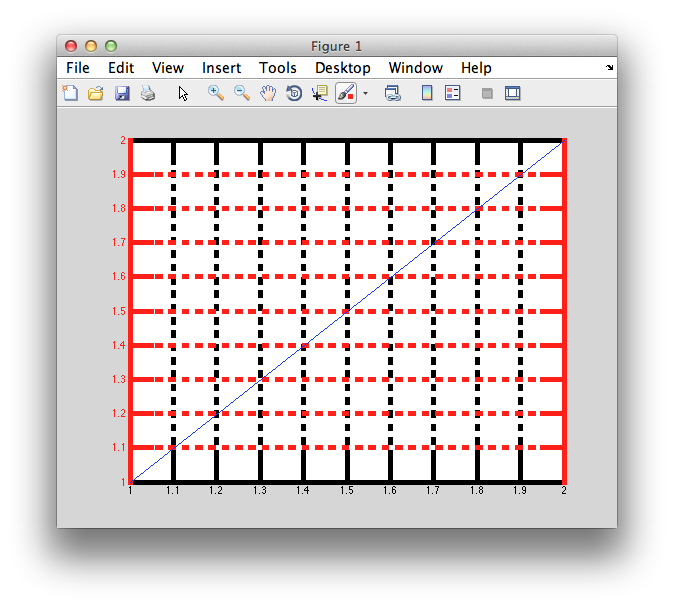
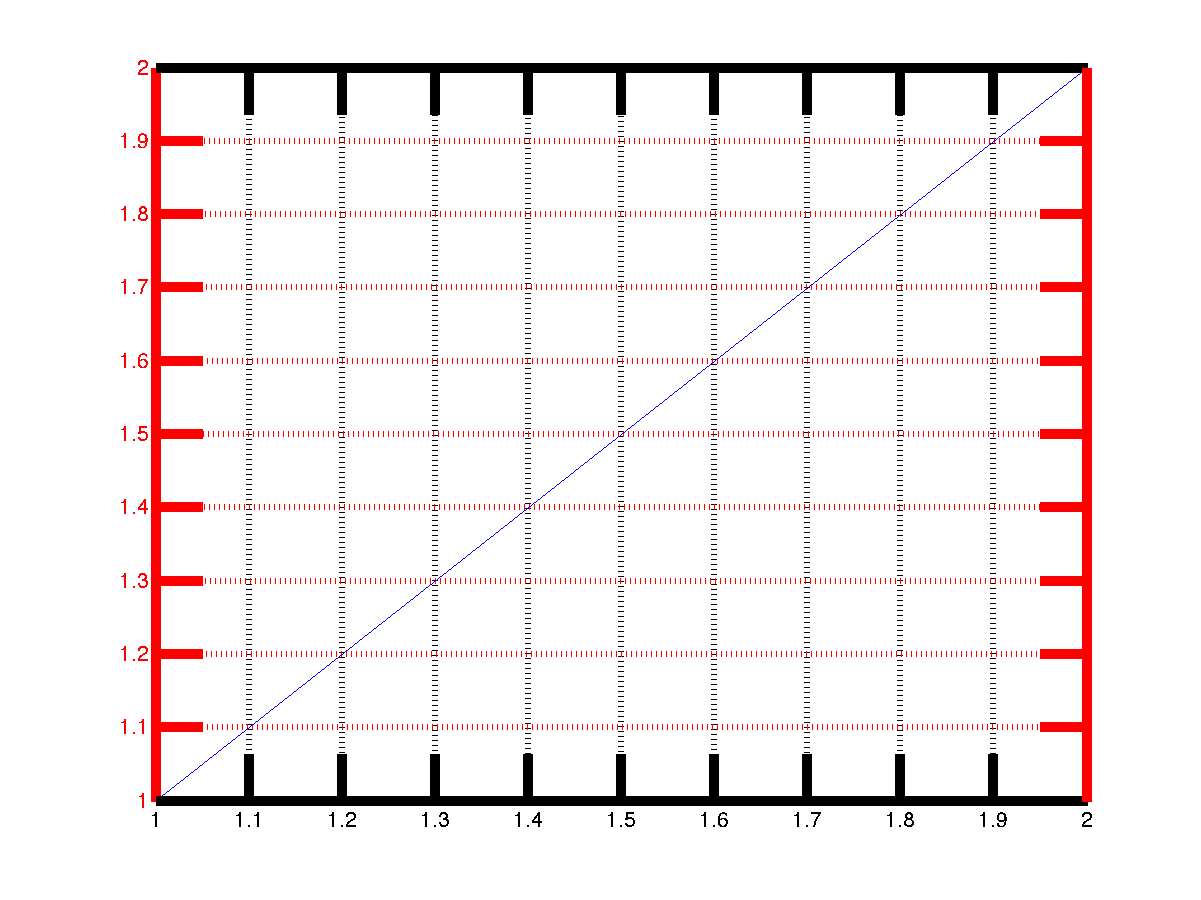
Could someone run the following code under Matlab and post the picture?
I'm trying to see whether tickmarks are plotted over the lines that form
the axes or not.
plot (1:2)
grid on
set (gca, 'linewidth', 5, 'ycolor', 'r', 'ticklength', [0.05, 0.05])
saveas (gcf, 'tst.png’)
Eugenio
--Rik