Description: PNG image
|
| From: | Giorgio De Nunzio |
| Subject: | Re: plot help |
| Date: | Wed, 30 Apr 2014 00:11:21 +0200 |
| User-agent: | Mozilla/5.0 (Windows NT 5.1; rv:24.0) Gecko/20100101 Thunderbird/24.4.0 |
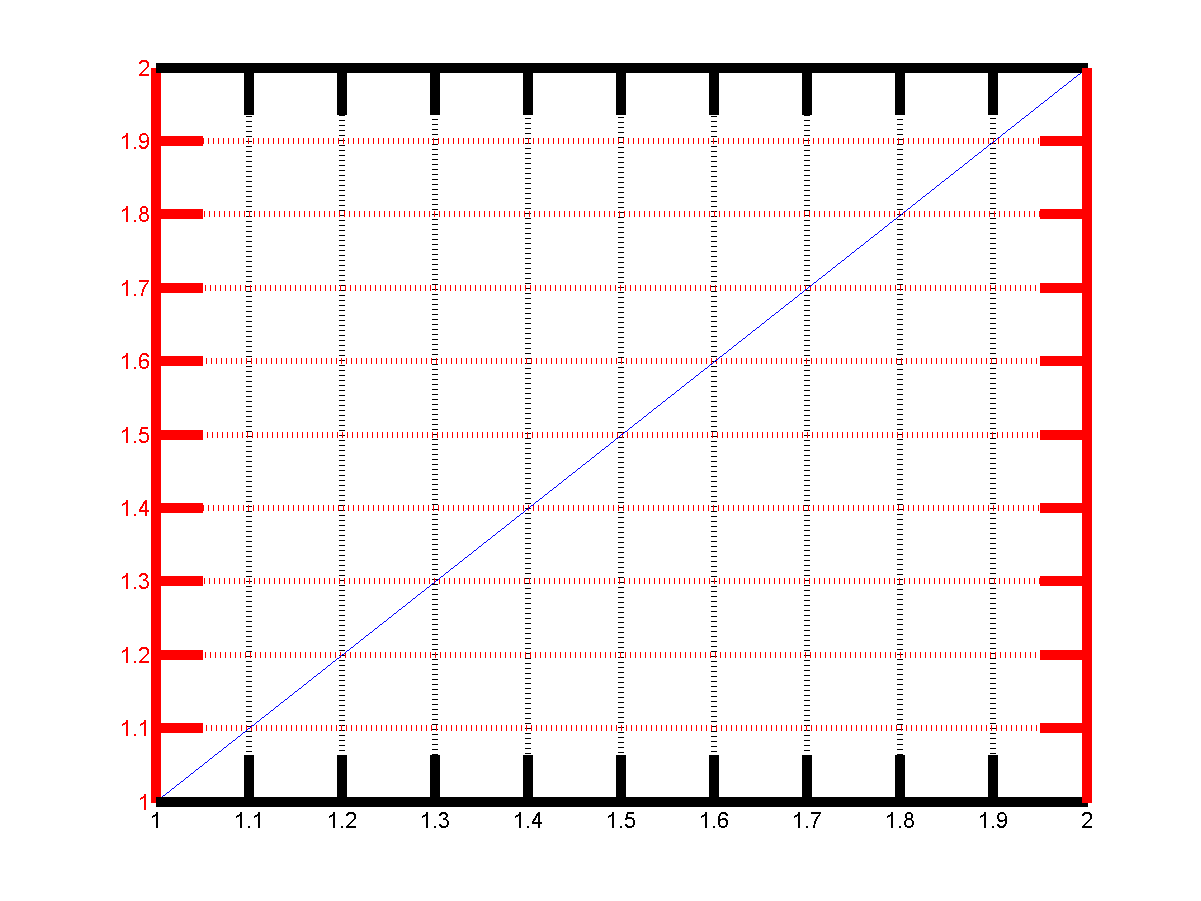
Here you are, I hope the attachment will get to the list.
Best regards
Giorgio

Il 29/04/2014 23.57, Colin Macdonald ha scritto:
On 29/04/14 22:47, Rik wrote:Could someone run the following code under Matlab and post the picture? I'm trying to see whether tickmarks are plotted over the lines that form the axes or not. plot (1:2) grid on set (gca, 'linewidth', 5, 'ycolor', 'r', 'ticklength', [0.05, 0.05]) saveas (gcf, 'tst.png')
--
Dr. Giorgio De Nunzio
Dipart. di Matematica e Fisica "Ennio De Giorgi", Univ. del Salento
INFN Sezione di Lecce
ADAM (Advanced Data Analysis in Medicine) srl
Lecce (Italy)
address@hidden
address@hidden
tel +39 0832 297084-297051
fax +39 0832 297100
mobile +39 320 3829845
![]() tst.png
tst.png
Description: PNG image
| [Prev in Thread] | Current Thread | [Next in Thread] |