Hi everyone,
We are working on an experiment for a conference paper deadline in two weeks, and need to transmit and receive OFDM packets and want to study the constellation diagram and BER.
I put together a flow graph consisting of an OFDM transmitter block and an unpacked OFDM receiver based on the online example rx_ofdm.grc. Here's how I'm trying to measure constellation diagram and BER:
- I inserted a QT constellation sink right before the constellation decoder on the payload IQ stream, but it does not seem to output anything meaningful. The plot just shows single, clean points, which I am pretty sure does not correspond to real data. I suspect that the plots are not triggering properly, but am not sure.
- For BER, we tried several different configurations, and they mostly give BER = 0.5 (i.e. random). Our leading theory is that we're not comparing the data at the correct points in the flow graph. Any suggestions as to what the BER inputs should be would be helpful.
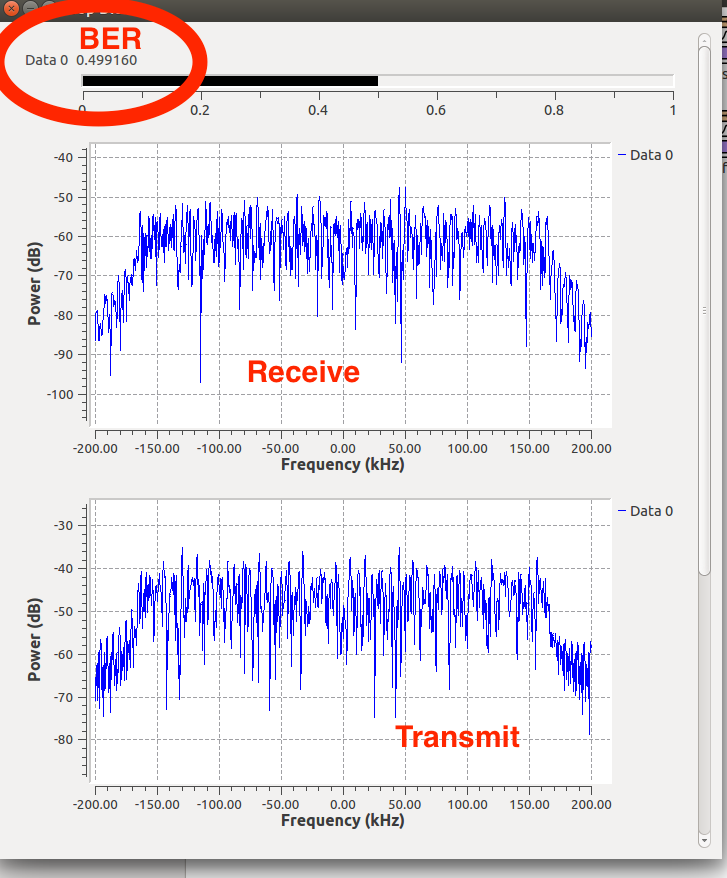
We've been running some diagnostics that seem to eliminate our communication channel as the problem:
- We are transmitting the data over-the-air at 915 MHz using two omnidirectional antennas, placed roughly 1 meter apart. The output spectra at the transmitter output and receiver input are attached - all signals are comfortably above the noise floor.
- From the tag debug output, we see that the OFDM packet headers are being received. For example, we can see when the packets are received, the packet numbers, as well as the channel estimation tap values. We take this to mean that we are receiving data successfully, and that our difficulties regarding BER and constellation diagram are something we're executing incorrectly in the software.
The relevant annotated GRC block diagrams are attached.
Thanks so much,
Jenny