discuss-gnuradio
[Top][All Lists]
Advanced

[Date Prev][Date Next][Thread Prev][Thread Next][Date Index][Thread Index]

Re: [Discuss-gnuradio] BER & constellation plot for OFDM transmit/receiv


From: Jingyi Sun
Subject: Re: [Discuss-gnuradio] BER & constellation plot for OFDM transmit/receive
Date: Fri, 22 Apr 2016 01:02:40 -0400

Hi Martin (and everyone else),

Thanks for your help! We’ve been able to make some progress on our questions:

Constellation Diagram:
As you mentioned, Martin, it was the hard decision that was forcing the output to just four dots. We wired the constellation diagram up to the output of the OFDM receiver FFT, but before the equalizer, and the constellation diagram became a fairly neat circle. I suspect that the diagram is a circle because the frequency/time synchronization, which is usually performed in the OFDM equalizer, is now missing. We will work on implementing an equalizer without the hard decision, and will ask if we have any questions.

Bit Error Rate:
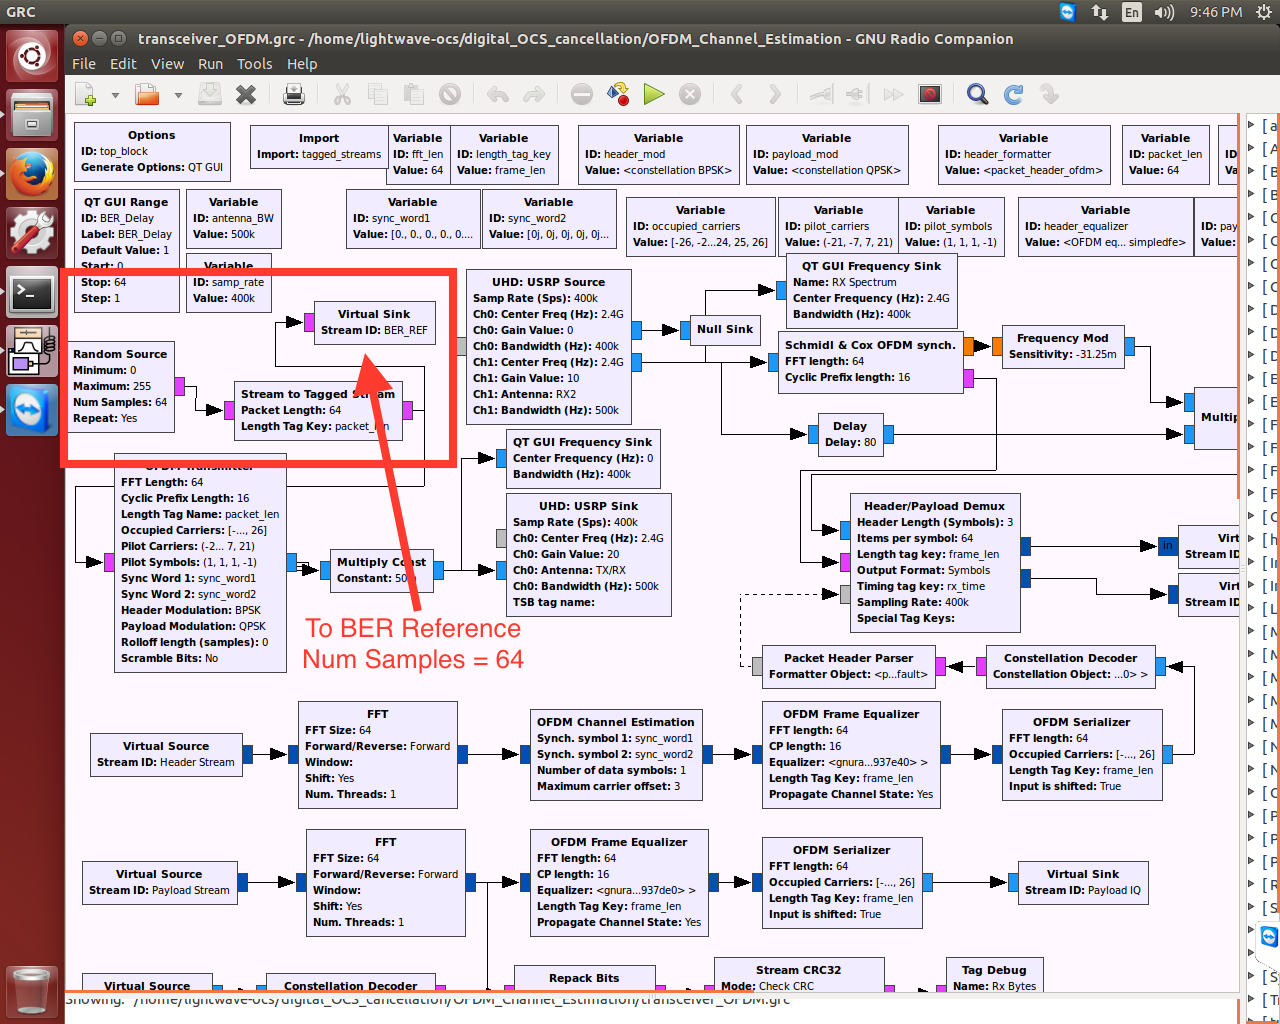
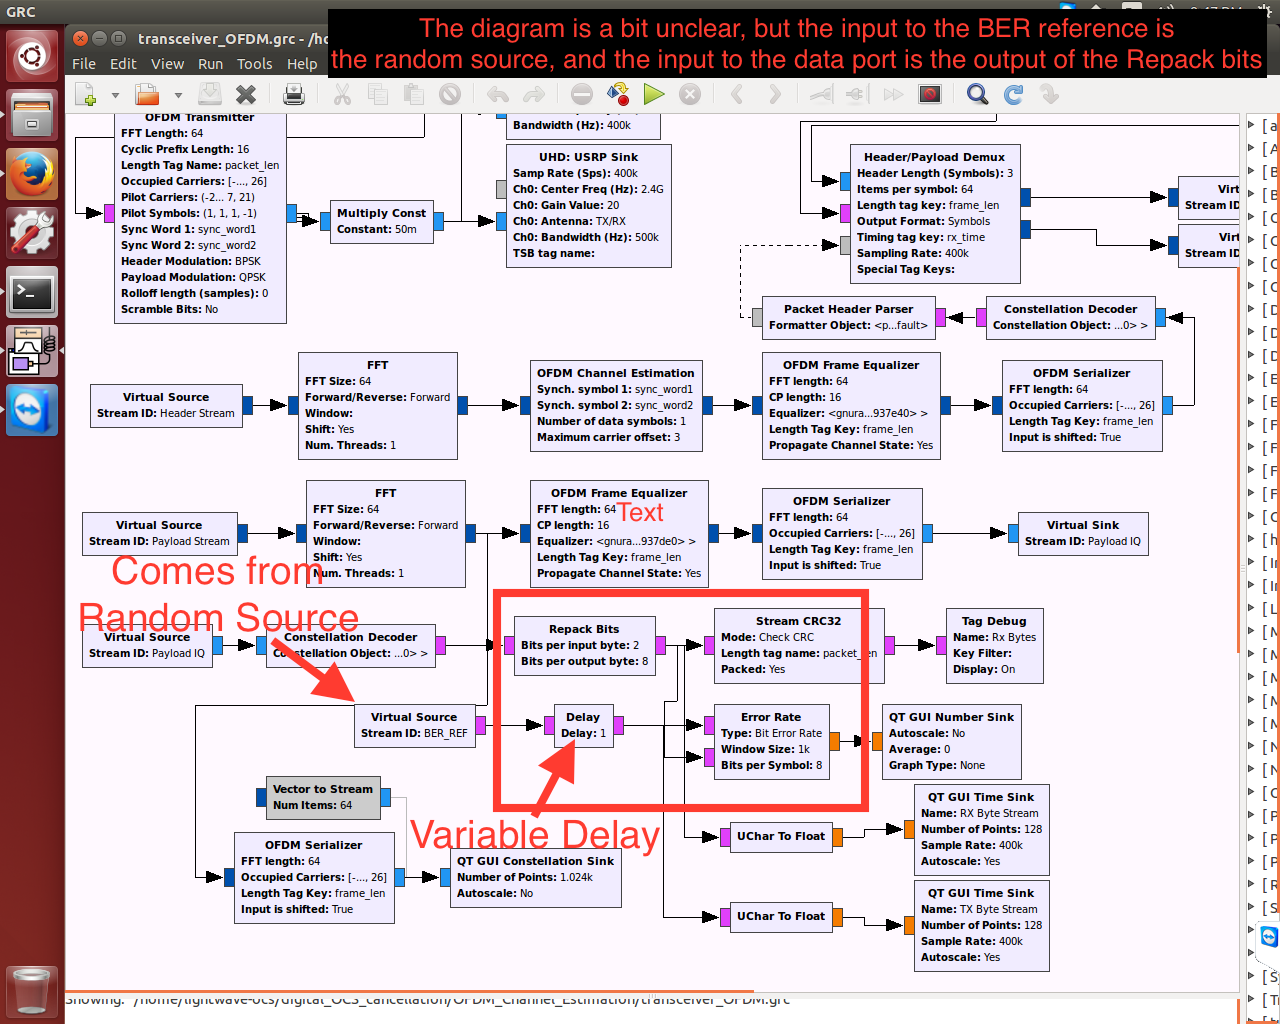
We found a helpful post online that indicated that perhaps the BER only works if the number of samples = the payload length of the OFDM process, which I believe is 64. After setting the random source number of samples to 64 (repeat = yes), we also added a variable 1-64 sample delay before the BER block’s reference input. We then ran the program, and varied the delay between 1-64 to see if the BER would drop. Unfortunately, we had no luck. 

To debug, we sent the two signals going into the BER block into two QT time sinks to do a visual comparison. What we found was that the signals were clearly identical. However, the signal going into the BER reference input (which came from the random source) was static, while the signal going into the BER data input was streaming. We were wondering if this had any affect on the measurement? I’ve linked to a video showing what I mean in the following dropbox link:

https://www.dropbox.com/s/usx2hx5uuhogxbi/Video%20Apr%2021%2C%205%2038%2047%20PM.mov?dl=0

In addition, I’ve attached two screenshots showing our flow diagram, with the relevant parts related to the BER highlighted. The two screenshots come from the same flow diagram, it’s just too large to fit on one screen.

Thanks again for all your help! Let us know if you have any ideas and we’ll give it go in the lab.

Best,
Jenny & Team


On Thu, Apr 21, 2016 at 2:11 PM, Jingyi Sun <address@hidden> wrote:
What do you mean by "hard-decision" equalizer, and "drop them down"?

Thanks so much!!

On Thu, Apr 21, 2016 at 2:01 PM, Martin Braun <address@hidden> wrote:
That's because the equalizer used is a hard-decision equalizer. You can
write your own equalizers and drop them down for better results; that's
something I've been meaning to do for a while, but haven't found the
time yet.

Cheers,
M

On 04/20/2016 09:56 PM, Jingyi Sun wrote:
> Hope pictures below give more context.   Has anyone seen this happen before?
>
> To reword the part of our question about constellation plots a little,
> does anyone know when the constellation block would output just four
> single points?
>
> The problem we’re currently facing is that the constellation plot does
> not even really show up -/there’s not even a giant blob to indicate
> noise/. Instead, we get only 4 points, one in each of the four locations
> you’d expect for a QPSK signal - but only those 4 points./It almost
> feels like the constellation plot stops triggering after these first
> four points/, and that’s why we don’t receive anymore data. *We’re using
> a free trigger on the positive slope, centered at 0, *which I feel
> should trigger at least something even if it’s just noise.  We have also
> tried other trigger methods, which output either 4 points, 5 points (1
> additional point in the center), or just 1 center point.
>
>
> ​
> ​
> ​
>
> On Mon, Apr 18, 2016 at 5:01 PM, Jingyi Sun <address@hidden
> <mailto:address@hidden>> wrote:
>
>     We are not compensating for any lost packets, although we would be
>     aware of them thanks to the packet number. Could you tell us if
>     there’s a block to do this, or would we need a custom block?
>
>
>     Also, could you tell us why the constellation diagram is not
>     displaying properly?
>
>
>     Thanks,
>
>     Jenny
>
>
>
>     On Mon, Apr 18, 2016 at 1:26 PM, Martin Braun
>     <address@hidden <mailto:address@hidden>> wrote:
>
>         Are you comparing the correct packets? E.g., if packets get
>         lost, do you
>         take that into account?
>
>         M
>
>         On 04/16/2016 02:38 PM, Jingyi Sun wrote:
>         > Hi everyone,
>         >
>         > We are working on an experiment for a conference paper deadline in two
>         > weeks, and need to transmit and receive OFDM packets and want to study
>         > the constellation diagram and BER.
>         >
>         > I put together a flow graph consisting of an *OFDM transmitter
>         block*
>         > and an *unpacked OFDM receiver* based on the online example
>         rx_ofdm.grc.
>         > Here's how I'm trying to measure constellation diagram and BER:
>         >
>         >   * I inserted a QT constellation sink right before the
>         constellation
>         >     decoder on the payload IQ stream, but it does not seem to output
>         >     anything meaningful. The plot just shows single, clean points, which
>         >     I am pretty sure does not correspond to real data. I suspect that
>         >     the plots are not triggering properly, but am not sure.
>         >
>         >   * For BER, we tried several different configurations, and
>         they mostly
>         >     give BER = 0.5 (i.e. random).  Our leading theory is that we're not
>         >     comparing the data at the correct points in the flow graph. Any
>         >     suggestions as to what the BER inputs should be would be helpful.
>         >
>         > We've been running some diagnostics that seem to eliminate our
>         > communication channel as the problem:
>         >
>         >   * We are transmitting the data over-the-air at 915 MHz using
>         >     two omnidirectional antennas, placed roughly 1 meter apart. The
>         >     output spectra at the transmitter output and receiver input are
>         >     attached - all signals are comfortably above the noise floor.
>         >   * From the tag debug output, we see that the OFDM packet
>         headers are
>         >     being received. For example, we can see when the packets are
>         >     received, the packet numbers, as well as the channel estimation tap
>         >     values. We take this to mean that we are receiving data
>         >     successfully, and that our difficulties regarding BER and
>         >     constellation diagram are something we're executing incorrectly in
>         >     the software.
>         >
>         >
>         > The relevant annotated GRC block diagrams are attached.
>         >
>         > Thanks so much,
>         > Jenny
>         >
>         >
>         > _______________________________________________
>         > Discuss-gnuradio mailing list
>         > address@hidden <mailto:address@hidden>
>         > https://lists.gnu.org/mailman/listinfo/discuss-gnuradio
>         >
>
>
>         _______________________________________________
>         Discuss-gnuradio mailing list
>         address@hidden <mailto:address@hidden>
>         https://lists.gnu.org/mailman/listinfo/discuss-gnuradio
>
>
>
>
>
> _______________________________________________
> Discuss-gnuradio mailing list
> address@hidden
> https://lists.gnu.org/mailman/listinfo/discuss-gnuradio
>


_______________________________________________
Discuss-gnuradio mailing list
address@hidden
https://lists.gnu.org/mailman/listinfo/discuss-gnuradio


reply via email to

[Prev in Thread] Current Thread [Next in Thread]