[Date Prev][Date Next][Thread Prev][Thread Next][Date Index][Thread Index]
EZBin
|
From: |
Zafar Iqbal |
|
Subject: |
EZBin |
|
Date: |
Fri, 18 Sep 1998 17:48:26 +0100 (BST) |
Hi,

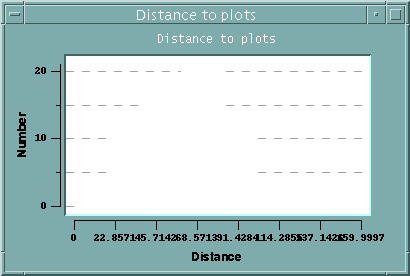
I'm not sure if my EZBin graph is working properly. In the
output there are no solid bars, the numbers on the x-axis
get 'mixed up' if BinNum is set any higher than 6. The
enclosed pictures are snapshots of the EZBin graph, with
BinNum set to 6 & 8 respectively.

My code is as follows. From my understanding the Y axis is
the frequency...
Also the getDistance function returns an integer.


  // Build the graph widget to display distance to plots
  distGraph = [EZBin createBegin: globalZone];
  SET_WINDOW_GEOMETRY_RECORD_NAME (distGraph);
  [distGraph setGraphics: 1];
  [distGraph setFileOutput: 0];
  [distGraph setTitle: "Distance to plots"];
  [distGraph setAxisLabelsX: "Distance" Y: "Number"];
  [distGraph setBinNum: 6];
  [distGraph setLowerBound: 0.0];
  [distGraph setUpperBound: (double)([[modelSwarm getWorld] getSizeY] +
                                        [[modelSwarm getWorld] getSizeX])];
  [distGraph setCollection: [modelSwarm getAgentList]];
  [distGraph setProbedSelector: M(getDistance)];
  distGraph = [distGraph createEnd];


  [displayActions createActionTo: distGraph           message: M(reset)];
  [displayActions createActionTo: distGraph           message: M(update)];
  [displayActions createActionTo: distGraph           message: M(output)];

----------------------
Zafar Iqbal
address@hidden

