On Thu, Aug 28, 2008 at 2:30 PM, Ben Abbott <address@hidden> wrote:

On Aug 28, 2008, at 7:22 AM, Shai Ayal wrote:


On Thu, Aug 28, 2008 at 1:47 PM, Ben Abbott <address@hidden> wrote:
However, switching to fltk appears to work ... well almost. The
plot doesn't render properly.
Can you elaborate on how it renders?

Perhaps a picture says it best?

octave:30> close all
octave:31> backend('fltk')
octave:32> x = 0:10;
octave:33> plot(x)
To underlying windows each contribute to the result in a rather
strange way. The resulting figure includes various sections of my
email client, and some things I don't recognize. In addition the
following line is displayed in the terminal.
octave:34> ca=nan

A picture is attached.
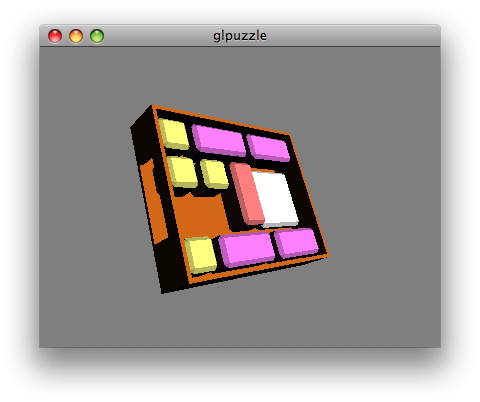
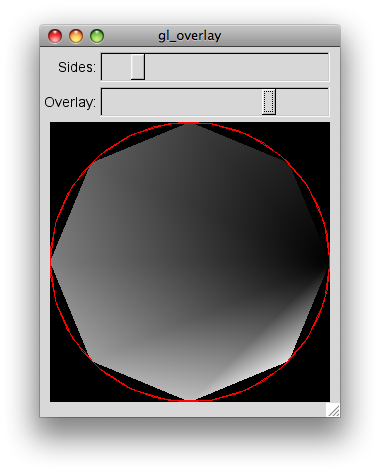
This looks like an OpenGL and/or fltk problem. The best way to debug
this would be to run the ftlk-opengl test programs gl_overlay and
glpuzzle and see if they work. You should have them in the test
subdir of the fltk sources. If you did not install fltk from source
it's a problem :(