Description: Zip archive
|
| From: | Vic Norton |
| Subject: | Re: Octave-gui graphics problems |
| Date: | Sun, 12 Jun 2016 17:29:06 -0400 |
I’m attaching a revised, graphic-testing script: qtbug.m
It along with the corresponding README.txt file are contained in the
following archive.
![]() octave-gui graphics problems on mac.zip
octave-gui graphics problems on mac.zip
Description: Zip archive
This is not a terribly complicated situation. We are talking about a
relatively simple, nonlinear map, which maps 3-dimensional space into
2-dimensional space and folds everything over the image of a "critical
line". The critical line is the line on which the rank of the
derivative of the map collapses to 1.
The only complication is that the source 3-dimensional space is an
affine subspace of R^253, the space of all possible adjusted closing
prices of financial securities for the 253 market days from 2013-12-31
to 2014-12-31 inclusive.
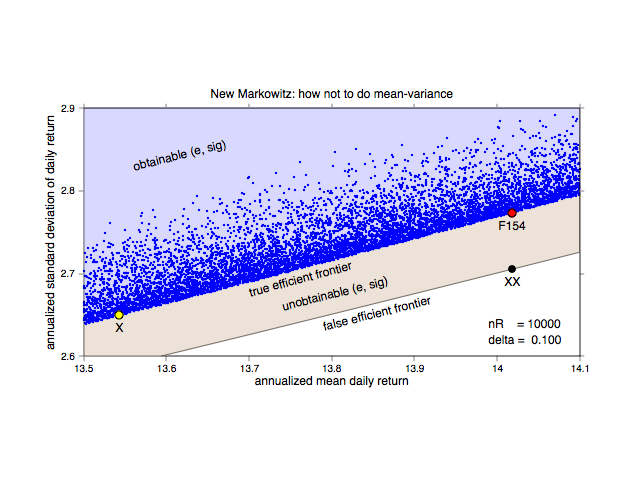
My script, qtbug.m, simply shows the images of a bunch randomly
generated R^253-points near the critlcal line. This script generates
2*nR random points, e.g., nR = 10000, 15000, 30000, near the critical
line; with delta = 0.10, 0.12, 0.15 specifying the closeness of the
points to the line (the smaller the delta the closer the points). It
then plots the image of each generated point that lies within the
clipping bounds
13.5 <= e <= 14.1 and 2.6 <= sig <= 2.9.
The computations in qtbug.m are pure numerical linear algebra. Octave
has no problems with these computations. But displaying the results
presents significant problems.
The qtbug.m script works fine in octave-gui when
octave> graphics_toolkit gnuplot
octave> setenv GNUTERM qt
are set, but, on my system,
octave> graphics_toolkit qt
produces seriously bad graphical results, and
octave> graphics_toolkit fltk
simply crashes Octave.
I am working on an iMac, running OS X 10.11.5, and I'm using the latest
homebrew version of Octave. As far as I can tell from participants on
this list, the graphical problems of octave-gui are not just an
artifact of my system. But I am a mathematician, not a computer
software specialist. I don't know what is causing the problems or how to
fix them. I can just point out that the problems exist and leave it at
that. And perhaps my script will help someone fix these problems.
Here are some rough elapsed time statistics (typically upper bounds)
from experiments with qtbug.m on octave-gui
gnuplot-qt
nR = 10000, mean = 0.32 sec, stdev = 0.02
nR = 15000, mean = 0.39 sec, stdev = 0.02
nR = 20000, mean = 0.46 sec, stdev = 0.02
nR = 25000, mean = 0.52 sec, stdev = 0.01
nR = 30000, mean = 0.59 sec, stdev = 0.01
qt
nR = 10000, mean = 0.36 sec, stdev = 0.03
nR = 15000, mean = 0.40 sec, stdev = 0.01
nR = 20000, mean = 0.46 sec, stdev = 0.02
nR = 25000, mean = 0.56 sec, stdev = 0.04
nR = 30000, mean - 0.62 sec, stdev = 0.04
fltk
nR = 10000, crashes for this and any other nR
What do the graphics look like?
gnuplot-qt - great! 3 illustrative PNGs are attached
qt - lousy on my system
fltk - sometimes a bad figure will come up before the crash
Attached PNGs: This is the way things should look (from gnuplot-qt).
labeling scheme: qtbug_gnuplot-qt_nR.delta.png
qtbug_gnuplot-qt_10000.100.png (61.0 KB)
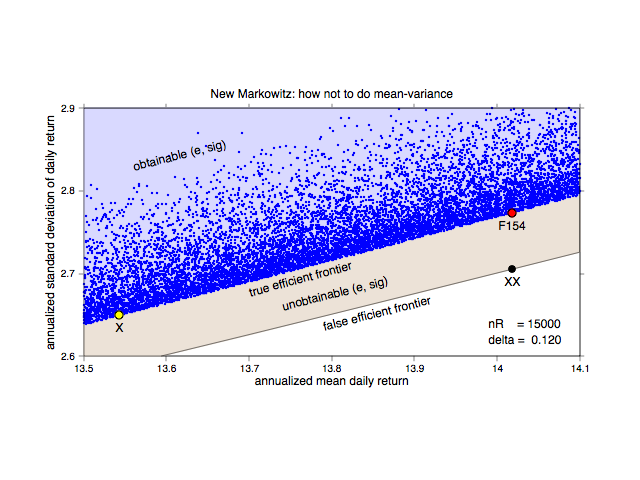
qtbug_gnuplot-qt_15000.120.png (69.9 KB)
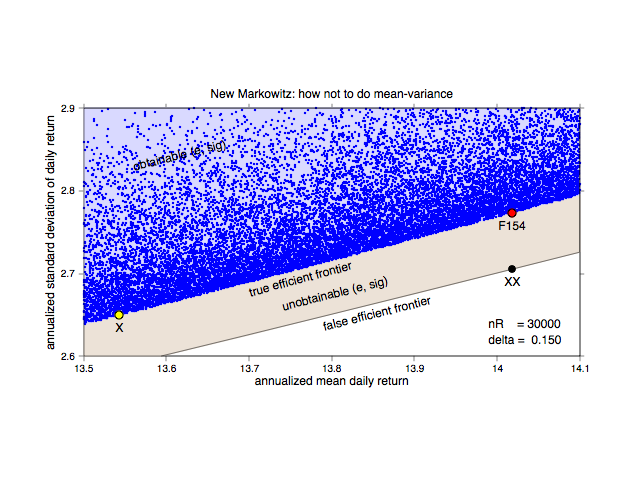
qtbug_gnuplot-qt_30000.150.png (80.4 KB)
When delta = 0.100 the random points hug the critical line.
When delta = 0.150 the points spread more away from the critical line.
When delta = 0.120 we are between these two parameters.
In all cases the random points cluster at the critical line from above.
A final note.
F154 and X represent the historical performance of two unattended
investment portfolios over 2014. The bogus portfolio XX and the false
efficient frontier are what MATLAB would generate from the same data.
Past history may not be an indicator future performance, but actual
history has got to be better than some numerical artifact reflected
off the back wall of Plato's cave.
Regards,
Vic
P.S. I’ve tried to include informative notes in my qtbug.m script.
| [Prev in Thread] | Current Thread | [Next in Thread] |